29 minutes reading | Também disponível em 🇧🇷
2020 Year in Review
Brace yourselves, like any other stats post, this one will be HUGE
If you’re following my blog, you know that I sometimes mentioned things were too hard and I couldn’t sit down and write. Looking back now, I have a good laugh for my past self. ☺️
I can say for sure that 2020 was a complicated year and a lot of things change in my life. The biggest change is that I’m now a father of twins. I still remember when a colleague mentioned: “I’m curious to see how your metrics post will be next year”. Well, I’m curious too, so let’s see.
Average day
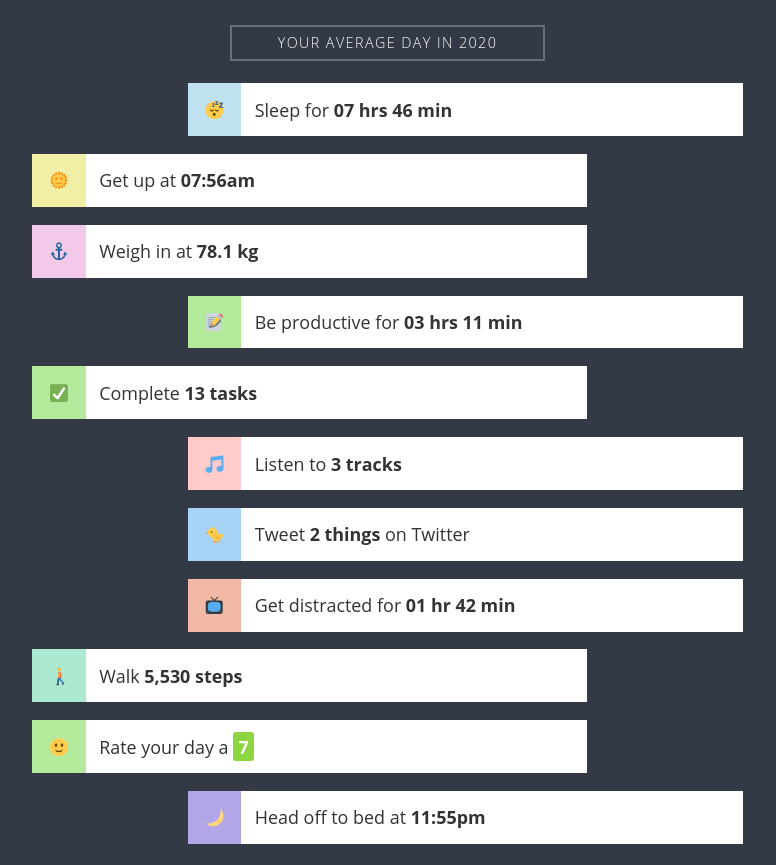
I’d like to start with what an average day is to me according to Exist.io because it feels like a TL;DR of this post:
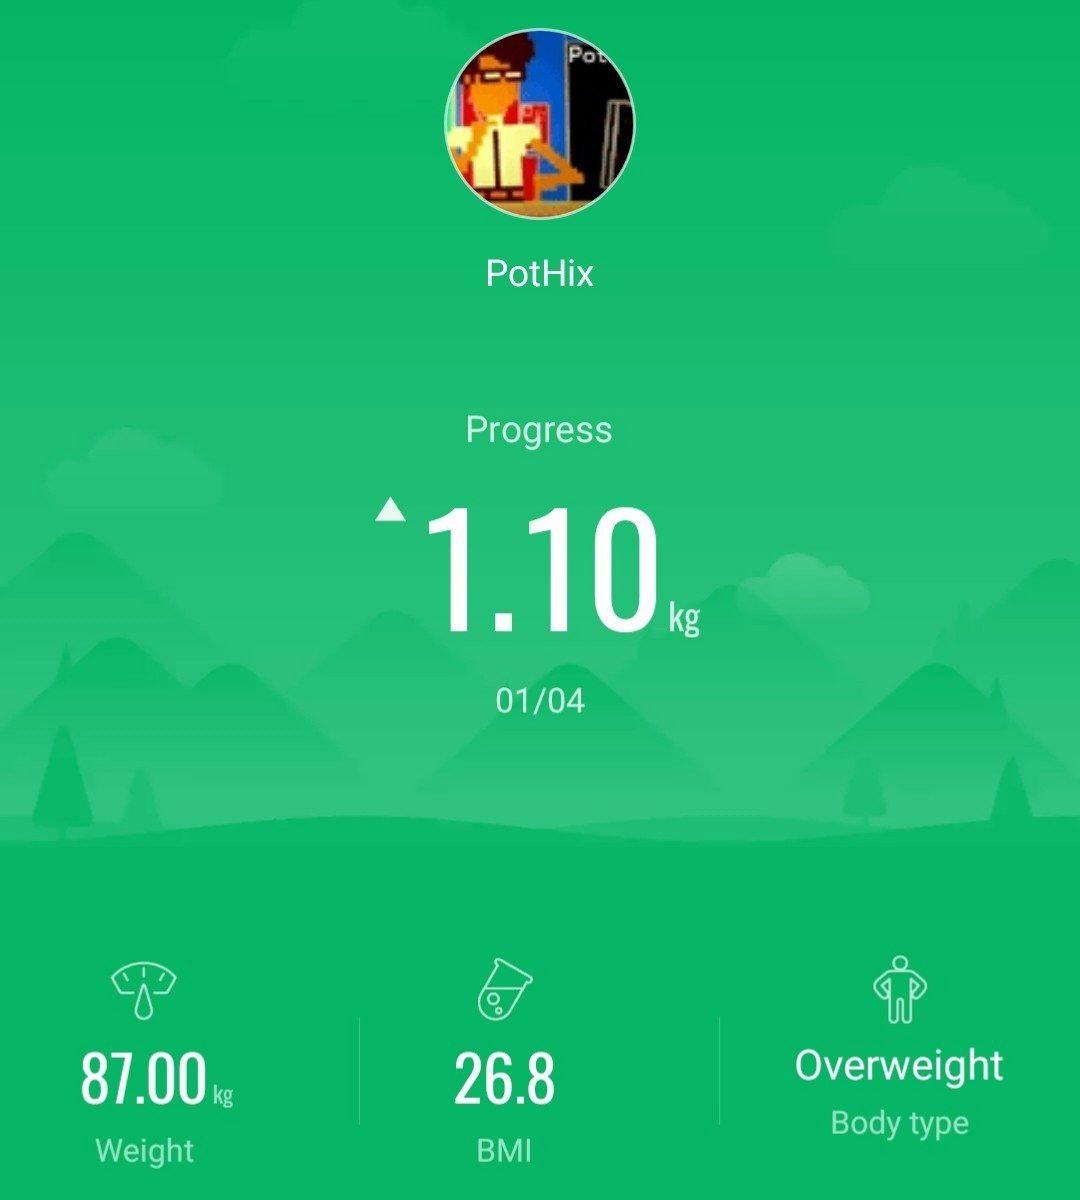
There’s one thing I’m certain about this: I’m not weighting 78.1kg. 😂 I probably forgot to add my weight to mi-fit this year because the gym is not a reality anymore.
Books
I had a much smaller goal this year. Instead of setting ~30 books, I just set 10 because I was sure my year would be totally different than anything I was used to. There was also the feeling that having goals were influencing my choice of books to read, so I wanted to try something different.
I’m glad to meet the modest mark of 10 books this year. It was not stressful and quite easy to reach the goal. I will probably do the same for 2021, if I read more than that (I don’t think it’s going to happen), it would be better than having a bigger goal and not be able to accomplish it.
You can see my 2020 Goodreads challenge here. :)
I used Google keep to take notes of all the books I read until the end of 2020 and I’m now using Roam research for that. All my notes are being consolidated there. Every time I finish a book, I review my notes and post them along with a review on Goodreads and on this blog. The plan is to migrate all my reviews here so I can own my content again.
If you want to see the reviews I already migrated, check the books out. If you see I didn’t migrate all the titles yet, you can always look for my whole list of books read in 2020 on Goodreads.
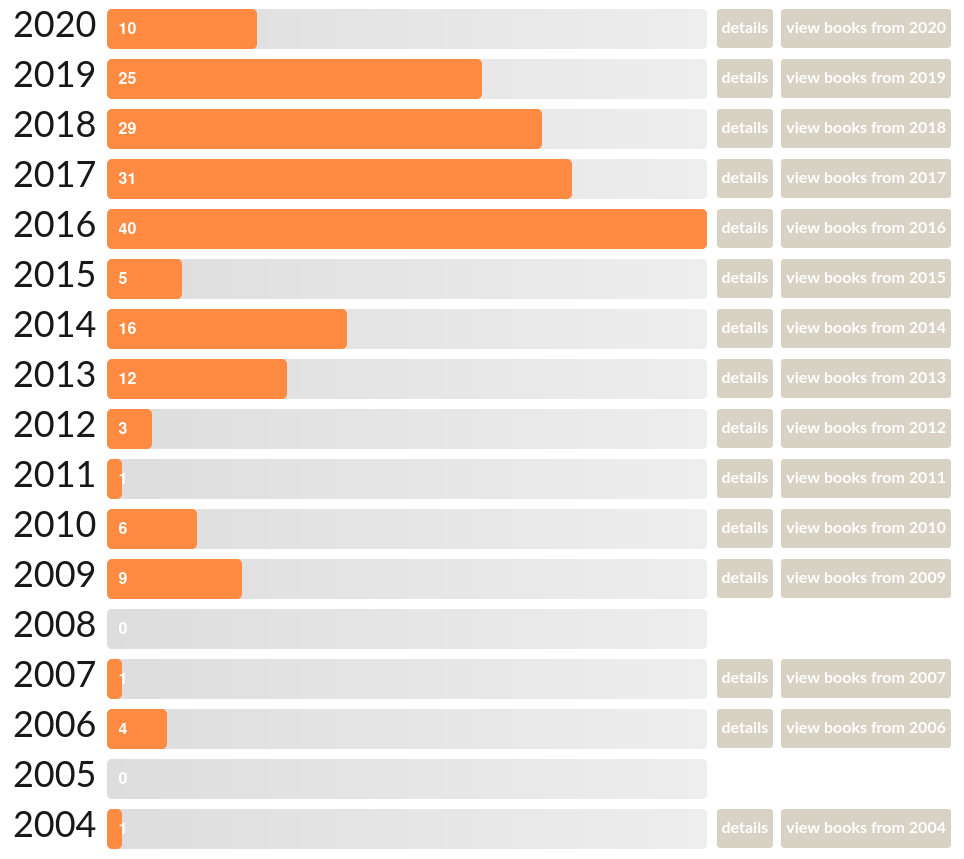
Here are some stats provided by Goodreads comparing all the books I have registered:
I can see now that I’m reducing the number of books I’m reading every year, but I don’t think I should be concerned about that. The number should not surpass the quality of books and how much I’m applying what I learn.
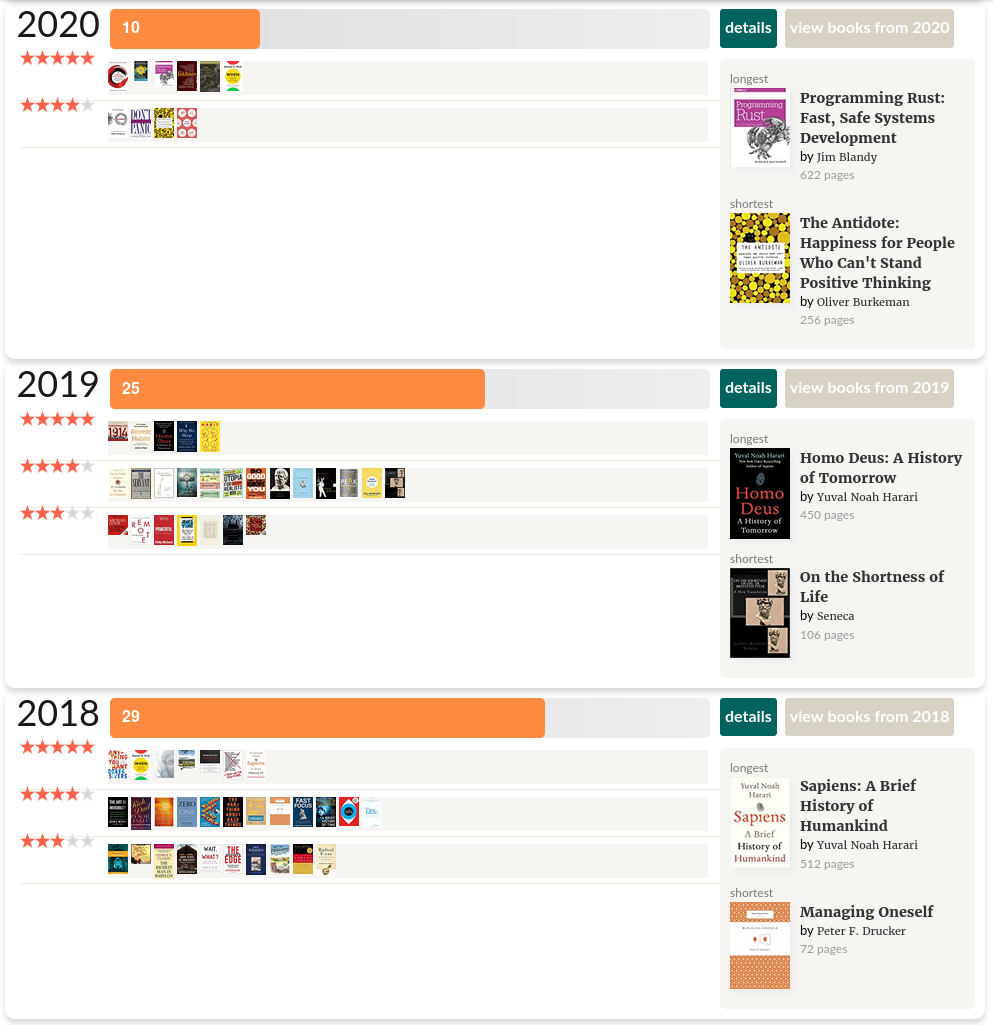
One of my concerns was related to the quality on my reviews. In 2018 I had a lot of 3 star reviews, so I tried to improve my picks in 2019 and got some improvements. Let’s see how was 2020:
Things are much better! For the first time I have more 5 star reviews than 4 stars! 🤩 This is one of the reasons why I love to have metrics, they help me realize what I’ve been doing and improve 💪.
As it happened last year, but after writing this section I’m feeling even better about the number of books I read this year and their quality.
Articles
The articles section for this year will be quite interesting because I decided to migrate my articles from Pocket to Todoist. I found I had a lot of things on Pocket that were worth reading but some others and didn’t make sense anymore (e.g. the macroeconomic news of 2017).
When I used the same old script I used for the previous year, the result was quite… Interesting:
In 2020, I had 484 articles unread and 3091 articles read compared with 2019 that I had 1908 articles unread and 1731 articles read, it’s quite a difference.
It doesn’t mean that I read 1500 articles this year (Exist says I read 996 articles), but at least I’m sure there were 500+ garbage articles there.
When checking my Todoist project, I can see I have 149 completed tasks there and I can trust this value now. ✅
The result of this metric is not very good because I messed up with my numbers. Let’s consider I read 149 articles this year, it’s not that bad compared to the 275 I read last year, but the number is decreasing every year. Let’s see what is going to happen in 2021.
Coding
All my coding metrics are provided by Wakatime. When we have a light blue bar inside a dark blue one, it means the light one is the global average and the dark one is the top coder. We should usually focus on the light blue part of the bar.
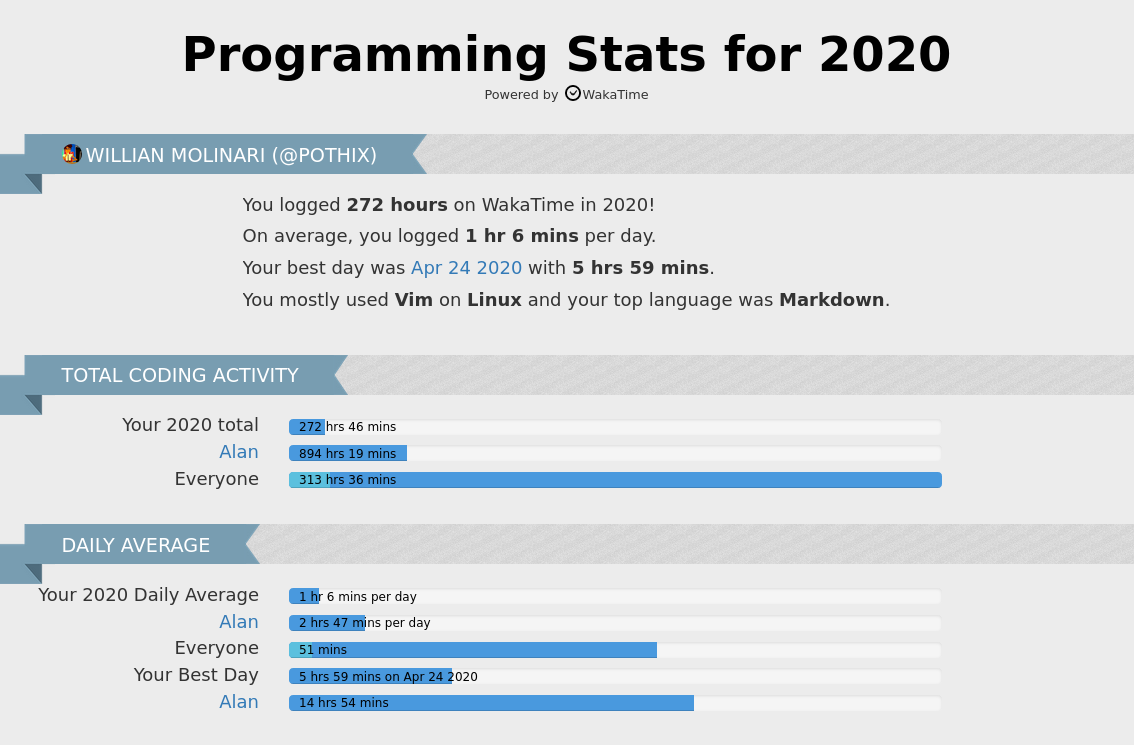
First, let’s take a look at the total time coding:
My daily average this year is even lower than the 1h16 per day I got in 2019, which looks really low for me. I’m still above the average, but 51 mins on average is a bit weird 😐. The only thing that makes me feel better here is that I’m not the only one who had its time decreased, it seems to be a general thing.
Last year I said I was going to tweak the parameters on Wakatime but I didn’t do that. It seems I should give this a try now to see if it better adapts to my programming style. 🤔
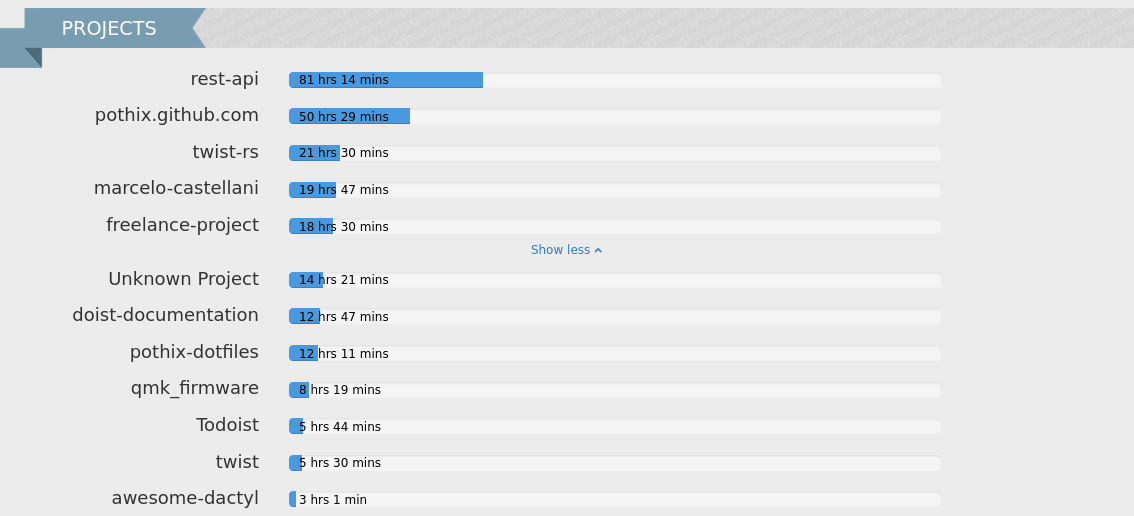
It’s nice to see that I dedicated 50+ hours to this blog. I just had a conversation about this on Twitter and it really takes time to create something great. I did a good revamp here and improved the content a lot. I’m proud of what I created here.
The twist-rs is an experiment of a multi-language library I was doing using Rust. Nothing production ready, but it was part of a “Personal DO” at Doist, where I could research anything I wanted and may be useful for the company.
Most of my time was developing the Todoist REST API written in Golang, which is nice to see here. I’m still working on Todoist but in a different repository now.
I still keep the same freelance job I have for more than 5 years now. It became almost a personal project for me. The good part of working for them is that the work is just coding and mostly fixing bugs. I just need to sit down and write some code.
I’m certain that I worked more than 18 hours during the year, that’s the main reason why I have to tune Wakatime. I usually don’t work much for them because I don’t have that much time to spare anymore, but 1.5 hour a month is certainly not right.
I liked to see awesome-dactyl and
qmk_firmware here. It means I dedicated some time to my custom keyboards
hobbies this year. ⌨
I’m just using Linux, so it’s expected to have it here. I’m using it much more than the average as we can see. The “top coder” is an outlier for sure. 😜
In 2019 I was transitioning back to Vim from Emacs and now the transition is fully done. It’s been a while since I don’t open Emacs. I still miss Magit, but other than that, life is good on the Vim side.
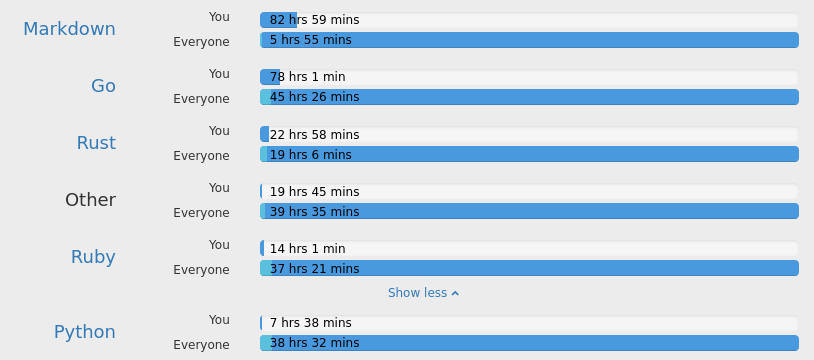
It’s very funny to see Markdown as the most used language this year. OK, I write a lot in markdown, but it shouldn’t be “my most used programming language” 😂.
I believe it’s all related to the way Wakatime tracks things and the way I deal with this. When I’m writing specs or blog posts, I just sit down in front of a text editor and write. When I’m writing code there’s much more research and testing involved and I believe it makes all the different for Wakatime tracking.
It was weird to see Python as the last in this list (the list is actually much longer, but I decided to cut it there) because Python is currently the primary language at Doist for the backend team. I’m not part of the backend team anymore and it may have its effects. Have it below Ruby was certainly strange. 🤔
Go as the first programming language was expected. I spent most of the previous year maintaining a Golang API. ☺️
I’m so happy to see Rust there, even knowing it’s not a language I’m using at work, but it means I gave it the attention I wanted. ❤️
Speaking
OMG, speaking! 😅 2020 was so crazy that I can’t even talk about speaking that much. I still maintain my talks page and I’m going to use it as a reference here.
- In 2020, I spoke 2 times, one in English and the other in Portuguese. One internal (for Doist) and the other for the Future of Work Brasil conference
Not much difference from 2019 and we had a pandemic this time. The only difference is that I did both presentations online, which is something I’m not used to. I love to be in conferences and doing things online is just a bit sad.
In 2020 we were organizing Rust LATAM again, this time it would be in Mexico but we decided to cancel the conference as soon as the WHO declared the pandemic. Being an international conference organizer in the middle of a pandemic is very tough. We were able to cancel everything without major problems thanks to the Rust community and Mozilla. I’m not sure I’m going to participate in any such adventure as the main organizer again.
I decided to collaborate with Rustfest global this year, but I was mostly a spectator and helper with anything related to Rust LATAM than a real organizer.
Completed tasks
Every year Todoist releases an astonishing Year in review. Here is mine from 2017, 2018, 2019, and now 2020, which is the one we’re going to explore.
Now that I work for Doist, everything I say here will be considered as the default because “I have to say good things about the company I work”, but what I’m saying here I really mean it and I would certainly say that if I was not working for Doist.
What the team does is incredible. My jaw dropped when I saw the year in review. The attention to details and the perfective of the world in such a difficult and unpredictable scenario is just amazing.
With that said, let’s check my Todoist tasks! 🙂
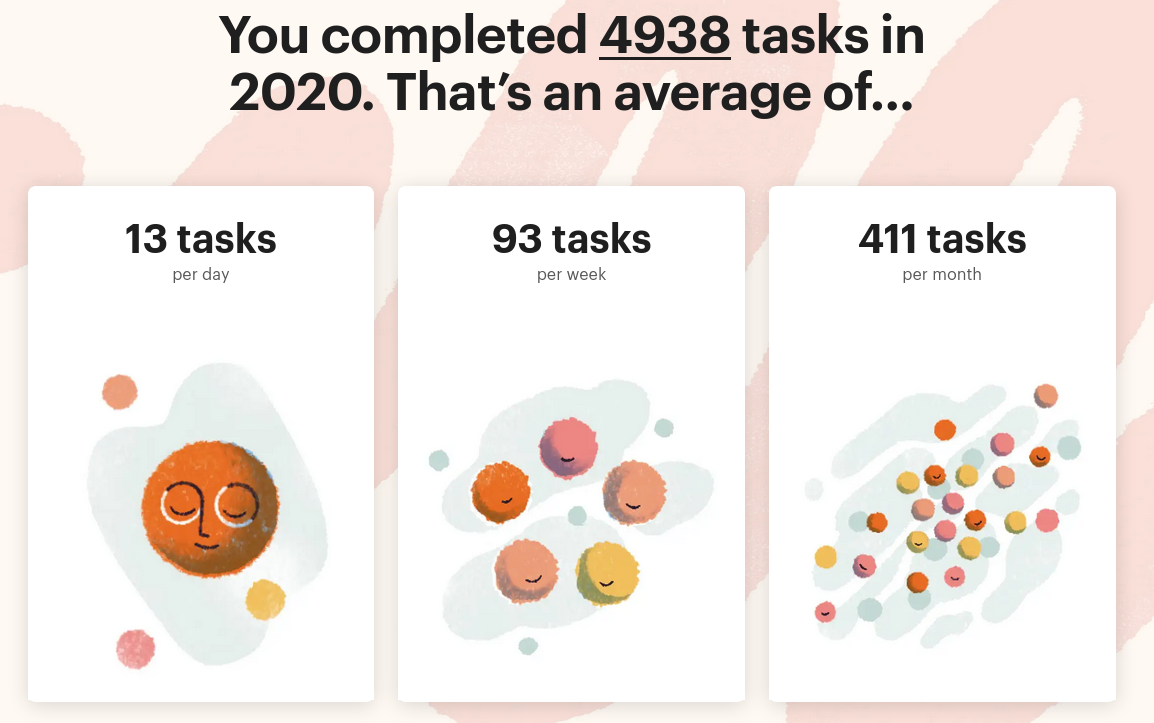
4938 tasks is much less than 2019, when I completed 6198 tasks. I believe this happened because I decided to remove some scheduling tasks I was maintaining before. It was so predictable that I mentioned this last year. 😉
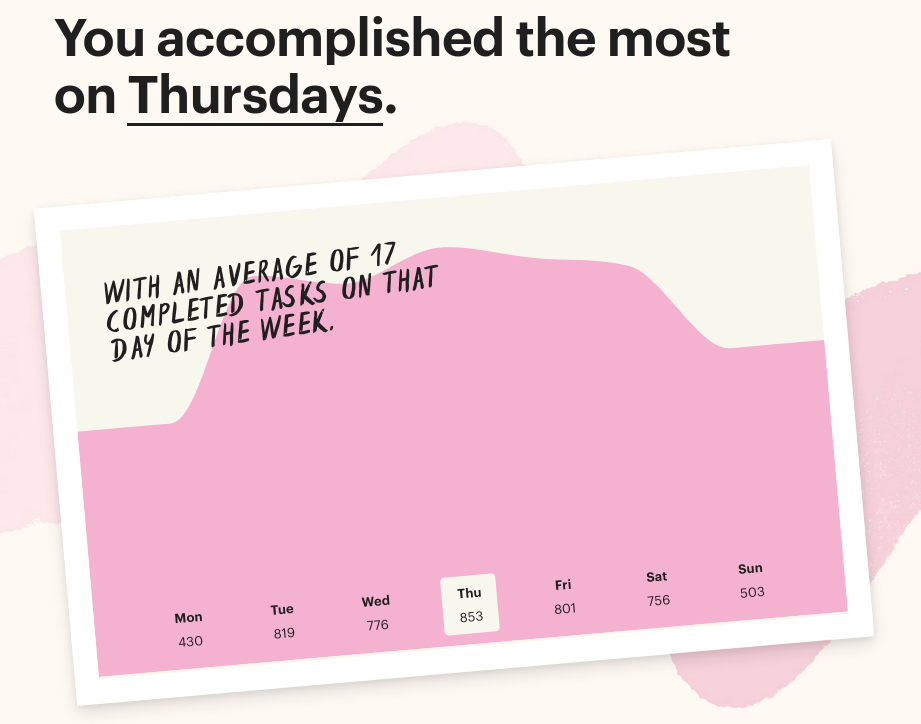
The day I complete the most is on Thursday, not Friday anymore as it happened last year:
My most productive time is 10:00, it did not change compared to 2019. This makes sense since I’m a third bird and feel more productive in the morning.
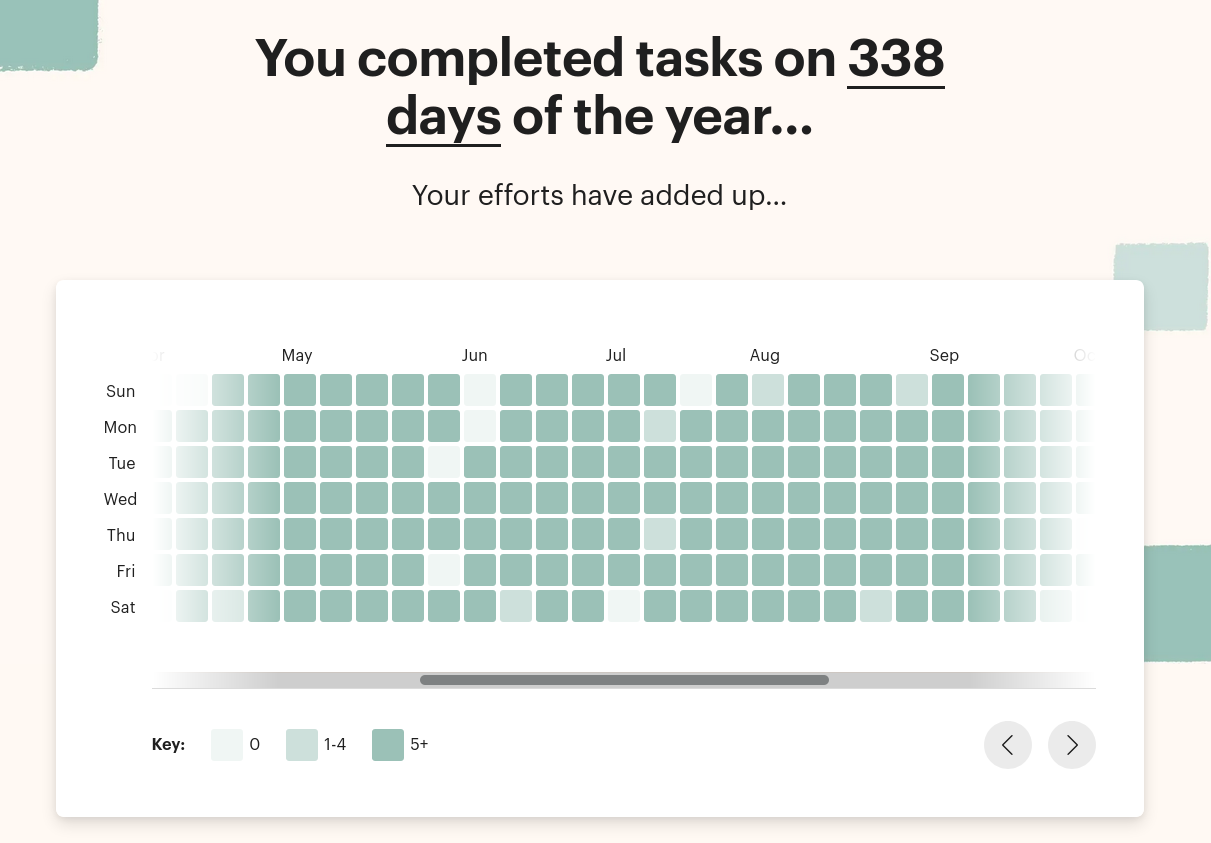
It’s nice to see I’m consistent using Todoist to manage my tasks:
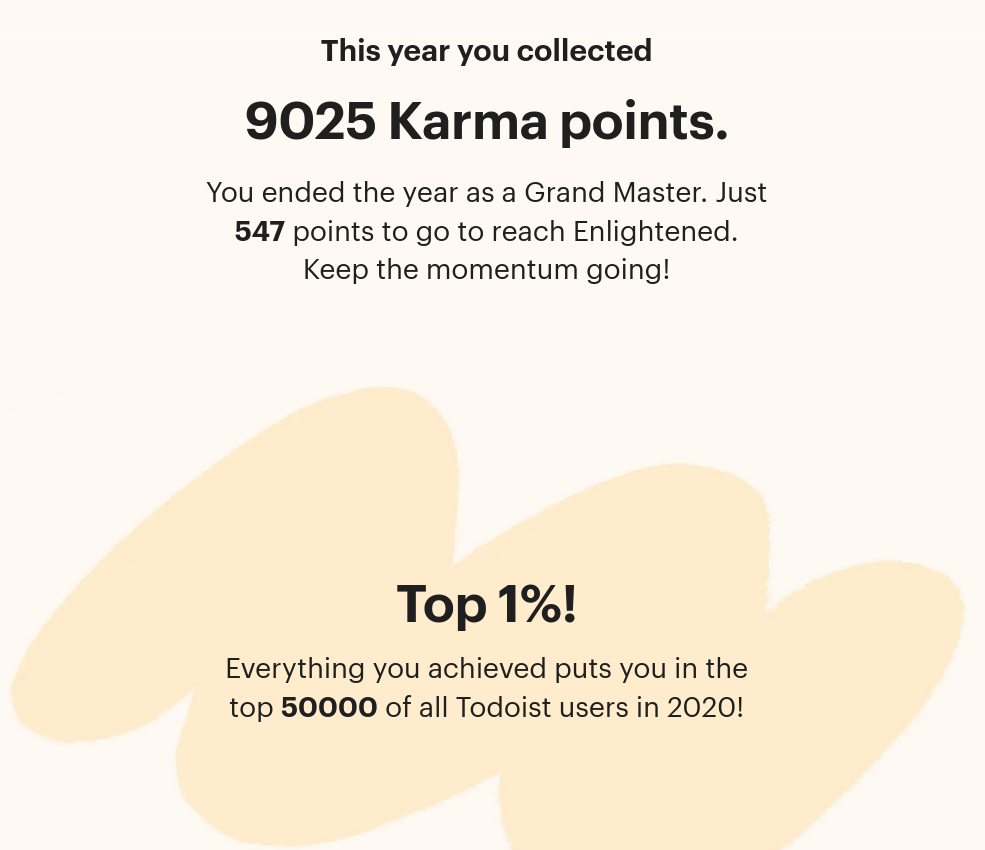
I’m still one of the 1% heavy users of Todoist! 😃 The image also shows that I’m a Grand Master close to become Enlightened. I’m writing this post in February, so I’m Enlightened already. ✨
Seeing the data I found interesting patterns. The first one is that I don’t care much about the karma streaks, I just ignore them. My longest streak was 2 weeks 😅.
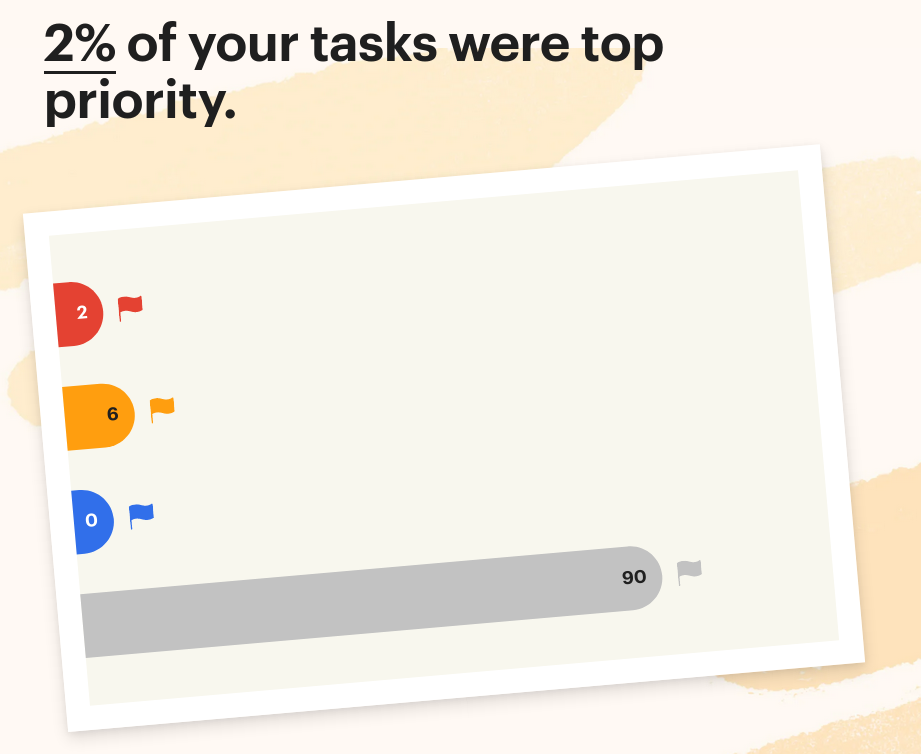
The majority of my completed tasks were not priority ones:
This is something I want to improve this year. I want to use the priorities better. 💡
Podcasts
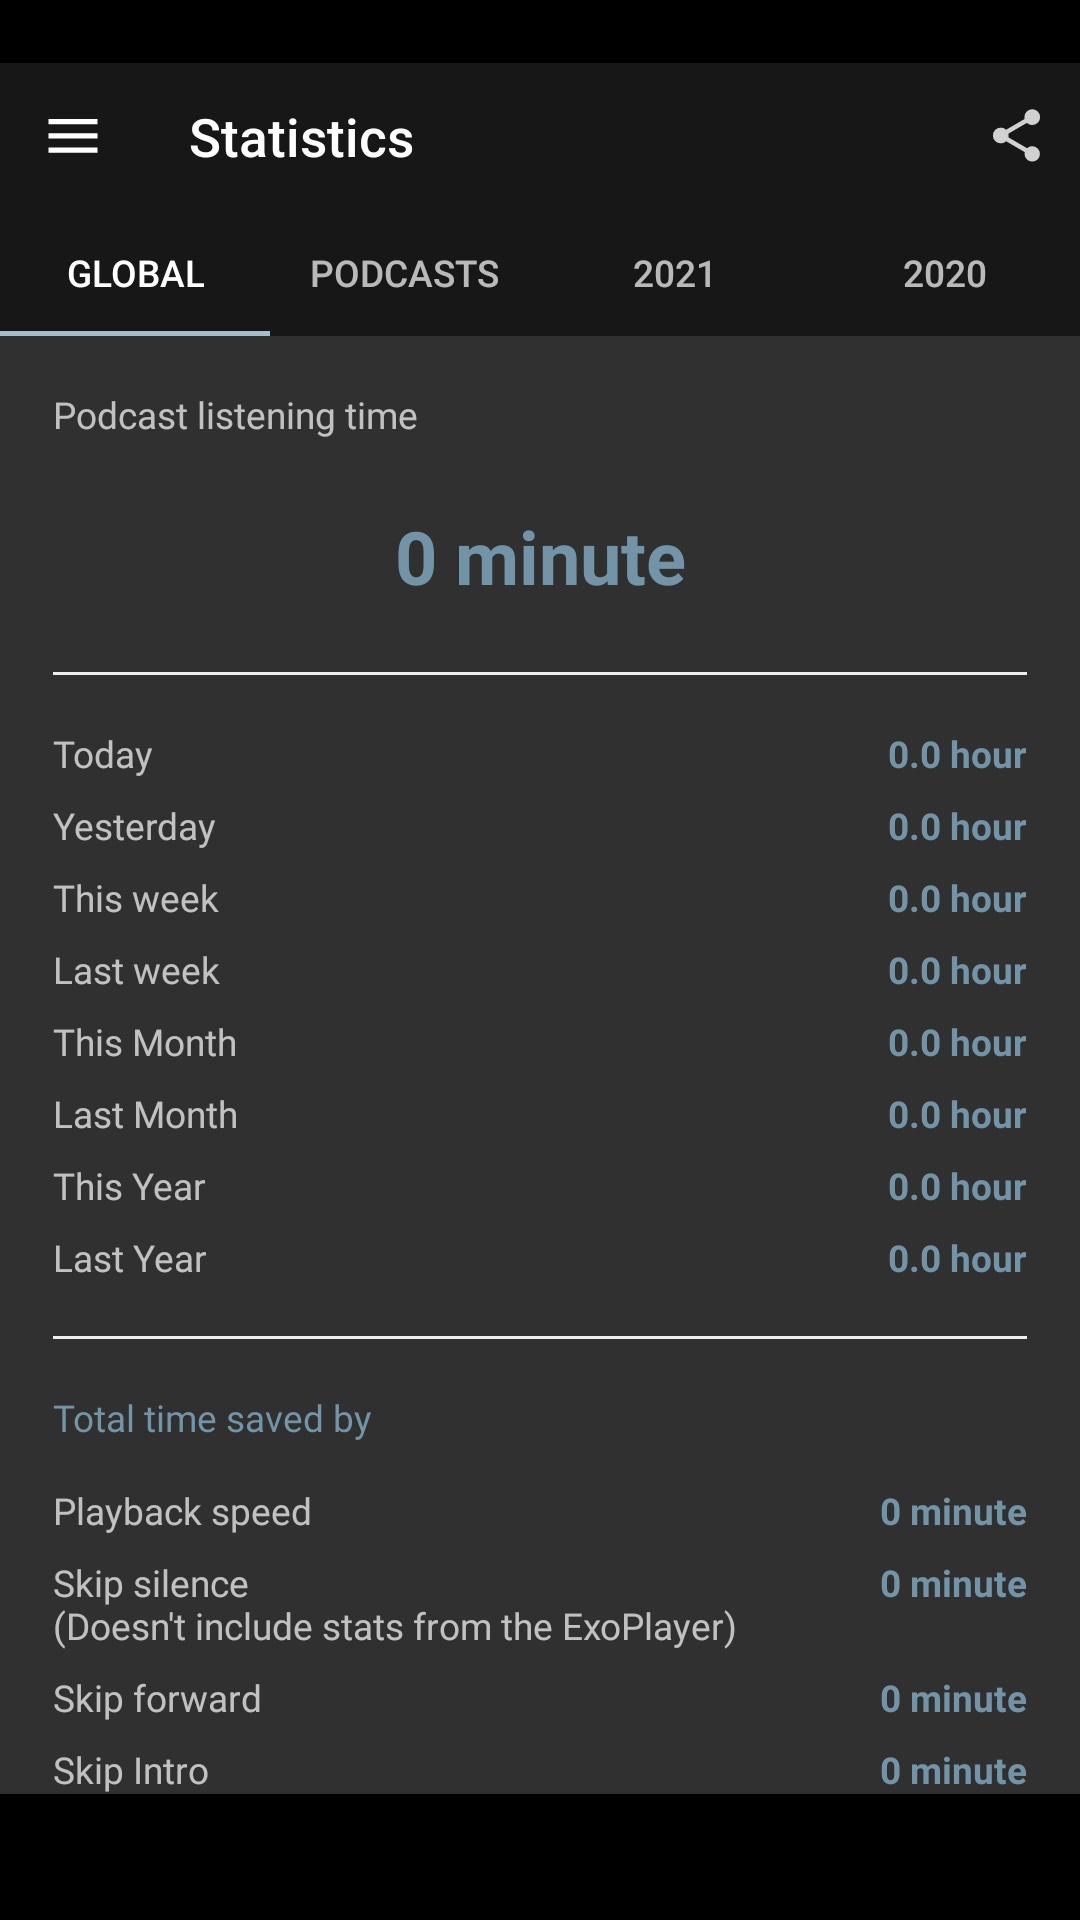
The image speaks by itself. I decided to reset my cellphone this year and didn’t even care to backup the data I had because there was not much to backup.
Without going for a walk with the dog every day in the morning and without my daily gym workout there’s not much space for podcasts and audiobooks anymore. I’m doing my best to keep audiobooks going, but it’s hard to prioritize podcasts.
This year, there’s not much to show here but I still want to keep the section. Hopefully, next year things will be better. 🤞
Hours working, focusing and distractions
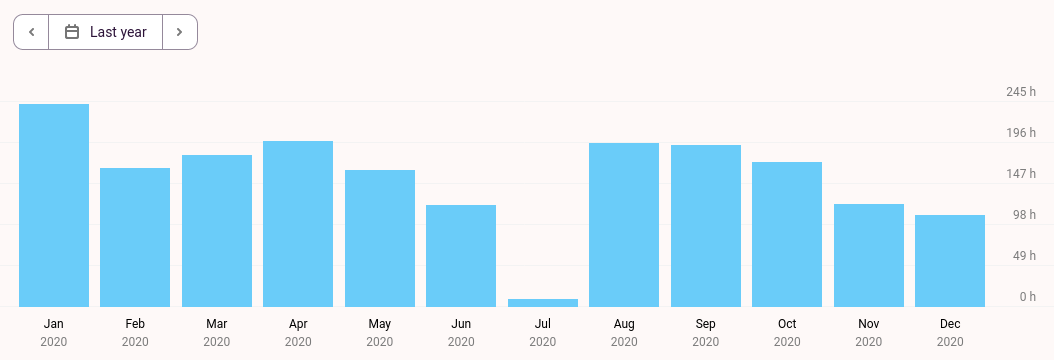
Let’s start checking all my data tracked using Toggl:
Comparing to the last year, I have much less hours tracked this year. In the past year I had 3 bars touching 255h and this year there’s not even 255h in the chart.
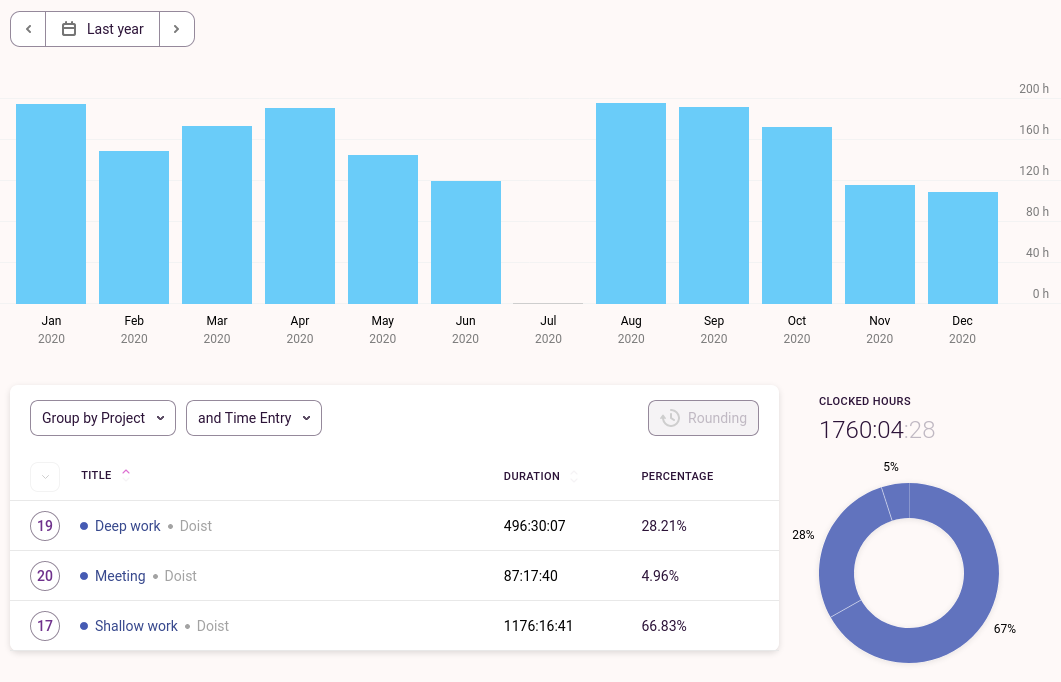
Let’s check my time working, considering my full-time job only:
It’s interesting too see that charts didn’t change much for my main job. It means just just had to de-prioritize anything outside of my work.
June is empty because it was the month when my babies left the ICU (yeah, they spent 40 days there, tough times, topic for a different post) and came home. That was when my paternity leave started. I decided to take one month of or paternity leave and then spread the rest of my time throughout the year.
It’s much harder this year to get to a good math about how many hours in average I’m working every day. I try to have at least 8 hours of work every day and this year it’s even harder to overwork because there are many creatures deserving attention at home now and there’s not time to overwork.
I spent 87 hours of my year in meetings, which is 6 hours more than I did last year. Most of them were weekly sync meetings with my remote team and also a monthly 1-on-1 with the head of my team. I consider most of those meetings productive, maybe not the checking but this is something to consider and raise the flag if they don’t feel productive. I like the way people see those things, it’s not blindly doing meetings because it “is the right way to do it”.
The most interesting part for me is the Shallow x Deep work ratio. I can see things improved since last year. Last year I realized I had almost 3 times less time Deep working than Shallow working but now it seems to be much better and close to half of the shallow work as Deep work.
To give a bit more context, I consider Deep work any work I can do without distraction. Shallow work is the work I do while I have other tabs opened on my browser or while I’m doing something else on the side.
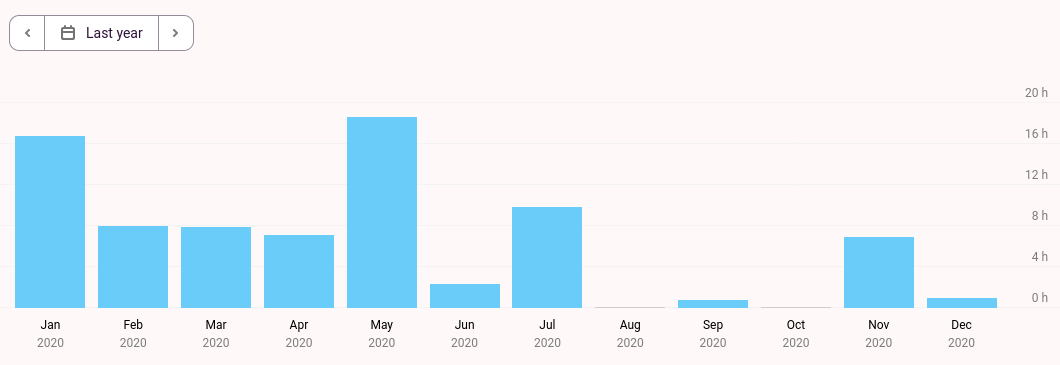
As I mentioned in my previous review, I keep one freelance job, which feels like a personal project to me. I like to improve the app and make it better. I don’t have freelance gigs, but this one I’m happy to keep. Here is the time I tracked about it this year (based on Toggl, not totally accurate):
Here it’s very clear to see when my paternity life started. The life of a new parent, especially of twins, is tough. Everyone needs attention and you don’t have time for anything. External work, even the one I like to do, had to be de-prioritized.
The average hours per month is close to 10 last year, much less than I used to do in the past.
Productivity data via Rescuetime
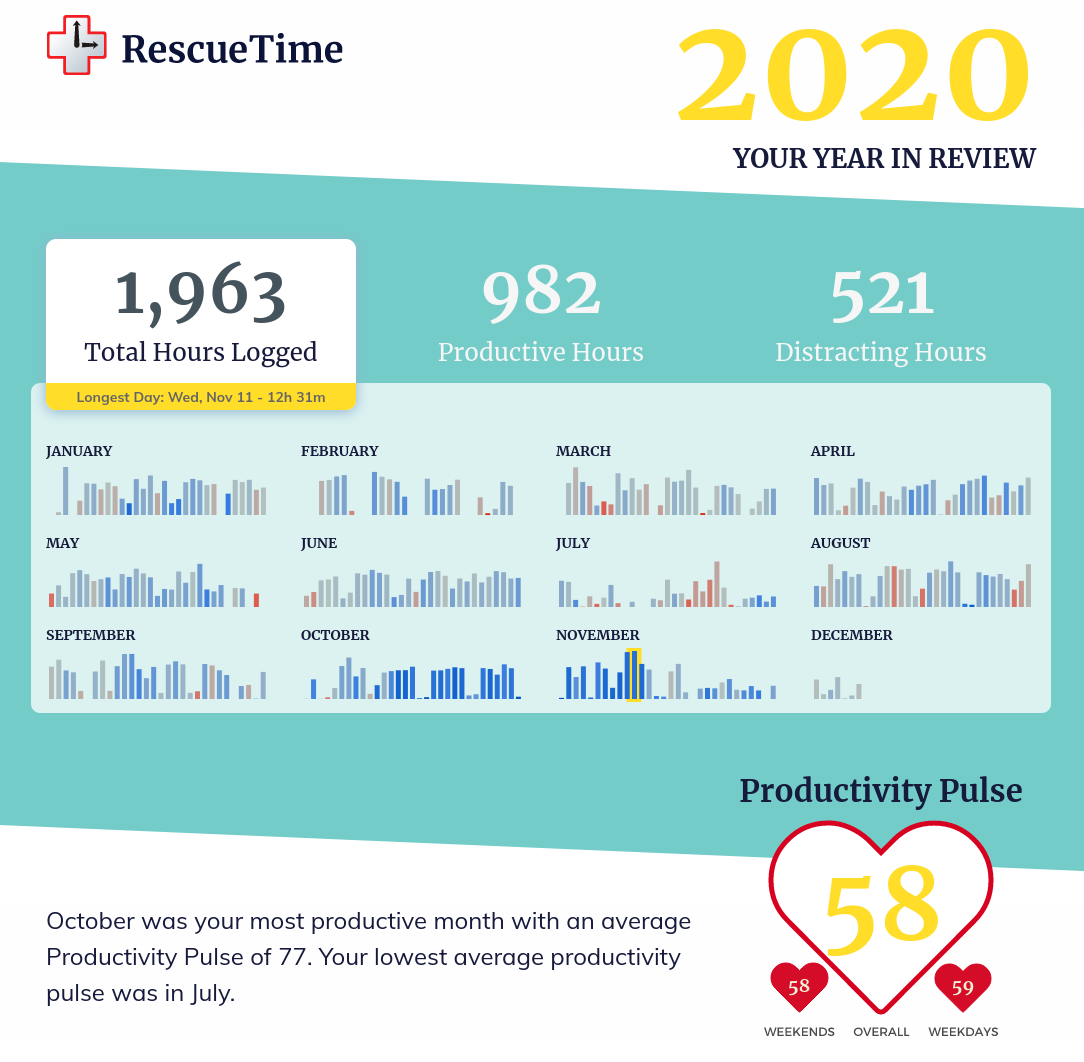
Let’s check what rescuetime has to say about my productivity. I’m going to use their year in review to extract metrics.
Let’s look at the productive and distracting hours for the entire year:
In December I started configuring my new laptop and rescue time decided to not report my data for some reason. It will be radio silent in December and January 2021. 😕
I love to see that my productivity pulse increased for the third year in a row: 51 in 2018, 54 in 2019, and 58 in 2020. ❤️
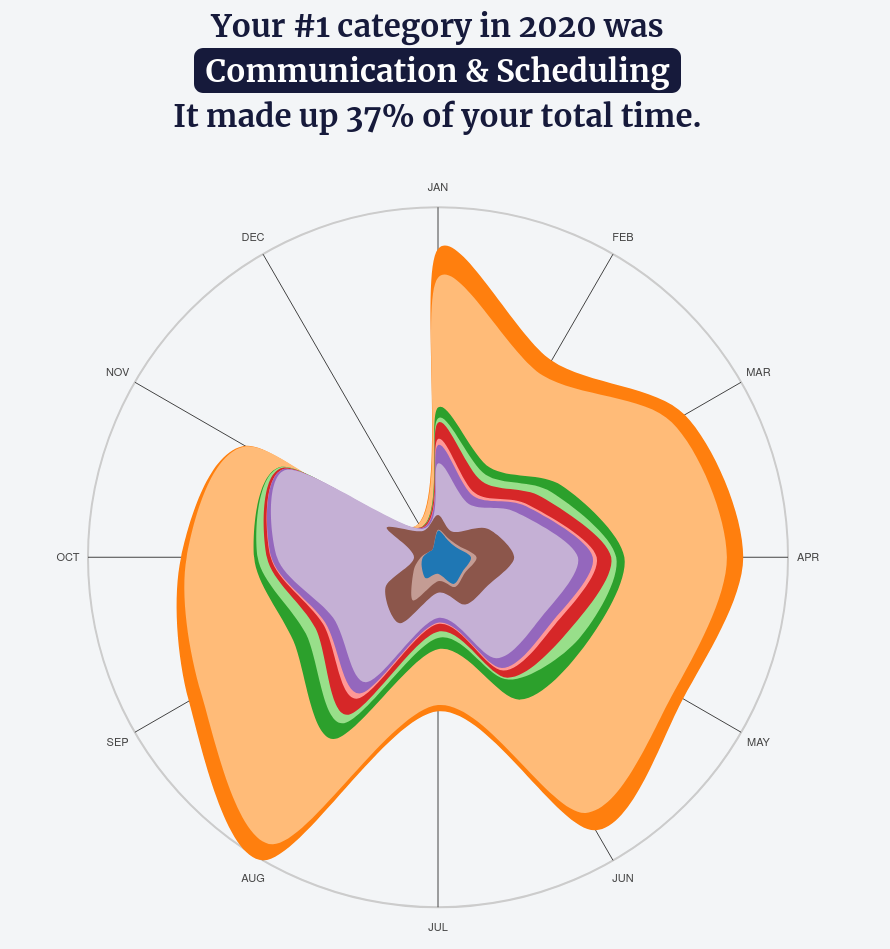
They also provide a chart with the categories I used the most:
I’m usually concerned about the amount of time I spend on communication and scheduling, which means mostly Telegram and Twist. I’m glad to see that it decreased from 42% in 2019 to 37% in 2020 🎉.
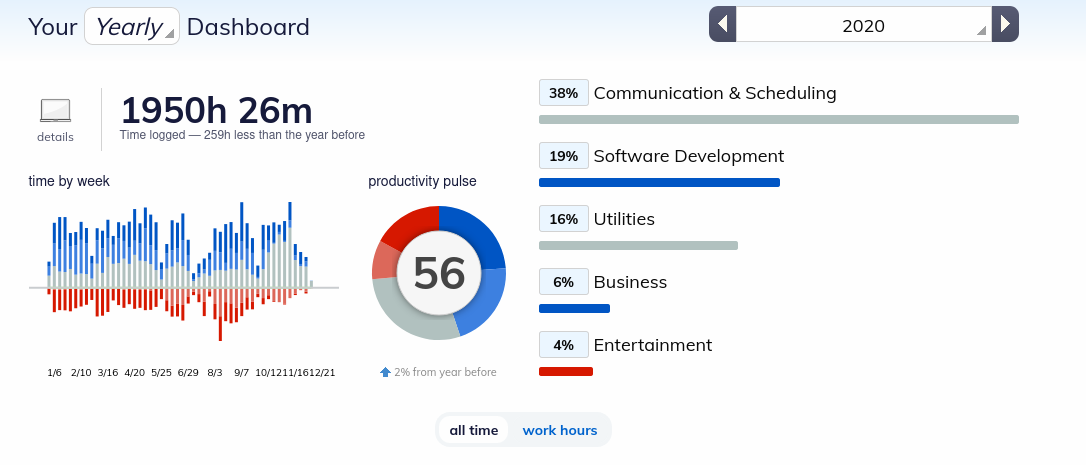
The dashboard shows similar information but with some other things:
The productivity pulse is usually different in the dashboard, I have no idea why 🤷.
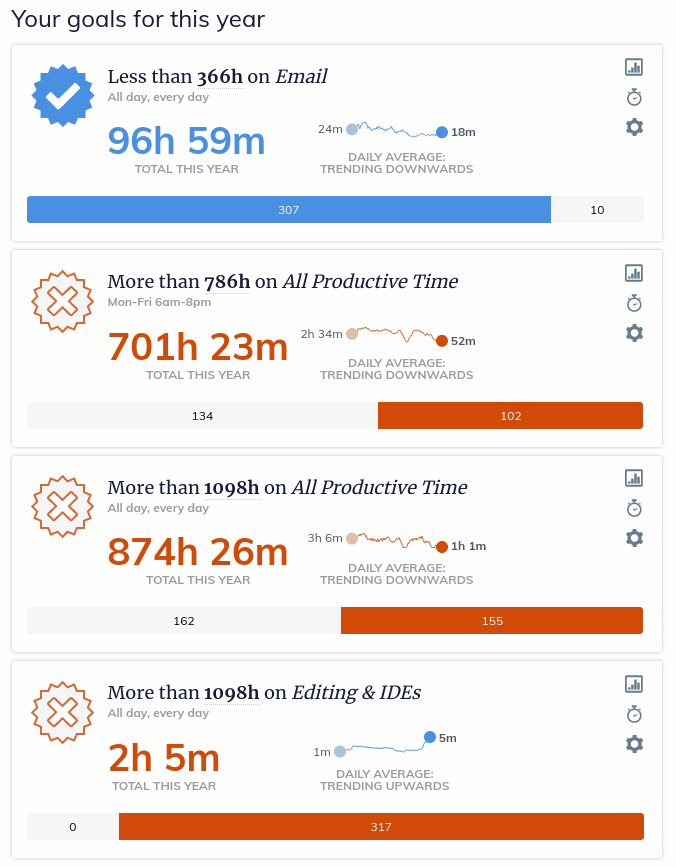
In the beginning of the previous year, I defined some goals in rescuetime but didn’t check them during the year. Looking at them now, it doesn’t feel very good:
I should probably set some reasonable goals for this year and follow-up closely. This will be something to keep an eye this year. 👀
In general I saw good improvement in my rescuetime productivity data. I’m glad to be checking it now. I will define some reasonable goals for the next year 🙂.
Music
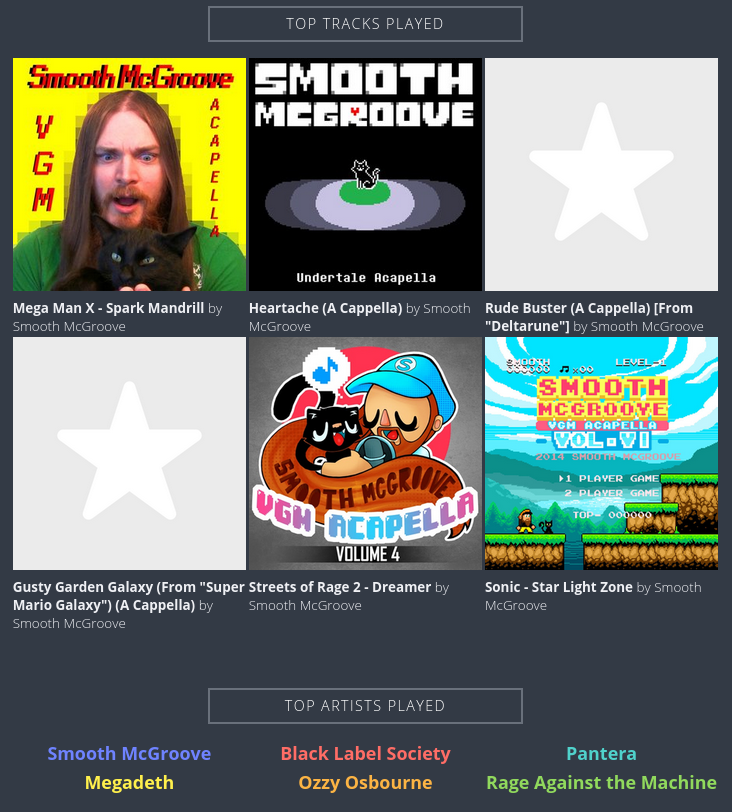
The last.fm review this year is not as good as the others from previous years IMO, but let’s take a look at it:
Google music was discontinued last year and I’m now using YouTube Music. It’s not that good but it’s good enough. The good part is that I now have YouTube premium (no more ads!).
I discovered 15% new artists this year. I ’m not very good in discovering new stuff, I usually listen to the same songs all over again 😅. It was nice to see that YouTube music exposes some YouTube artists as music there, that’s how I started listening to Smooth Mcgroove when working. I love video game music and Smooth Mcgroove makes 8bit songs singable. 😃
Other than that, we have the usual Black label society and Pantera in the second and third position there. No news here. 🤘
It’s interesting too see how tags are equally distributed in that chart. I don’t know if this is good or bad, or even if it means anything 🤔.
In 2019, I listened to more music between 10:00 and 11:00 but this year it changed to 18:00 and 19:00. I believe it’s related to the time I’m always done with work and need that extra boost.
This time I don’t have big outliers (as Thursday was last year). The pattern is the same between days of the week, which makes much more sense. I have no idea why I scrobbled so much in January of 2019 but it seems much better distributed this year.
Exist.io also provided data about the songs I listened to (via Last.fm):
No news here, basically the same as Last.fm already exposed.
TV Shows
This was a topic that was not receiving much love in 2019 and it’s even worse now. I’m still keeping it because I have some shows to recommend (maybe I will even create some special page to recommend TV shows in the near future 🤔) and I also want to write here how my life changed in the past years regarding TV.
I’m not tracking the TV shows I watch anymore and I’m not even watching that much to be honest. In the first half of 2019, I took some time to watch some TV shows with my wife, especially the documentary Babies on Netflix. It was great to see the scientific studies that led to the pediatric recommendations we have today.
We also watched a little bit of Vikings, which I enjoy a lot, but other than that, there was not much else to add to the list.
Last year, I said I was checking TV time because they were starting to add adding movies to the app, but I’m not even watching movies anymore and didn’t track anything.
More than ever, I’m realizing how 2020 was quite different than other years.
Physical data
In the previous years I did many things to try to extract data from my Miband. It was usually a combination of a lot of screenshots here and there but this year I don’t have enough time to dedicate to this and I’m going to rely on Exist.io for most of my data coming from Miband.
Let’s look at Exist.io’s monthly averages for steps:
This gives me a good idea of how 2020 slowed me down. The whole pandemic thing kept me at home after March. I decided to not go to the Gym anymore since then and was not even going for a walk anymore for some months.
I’m now going outside for a walk again, but it’s not the same 😕.
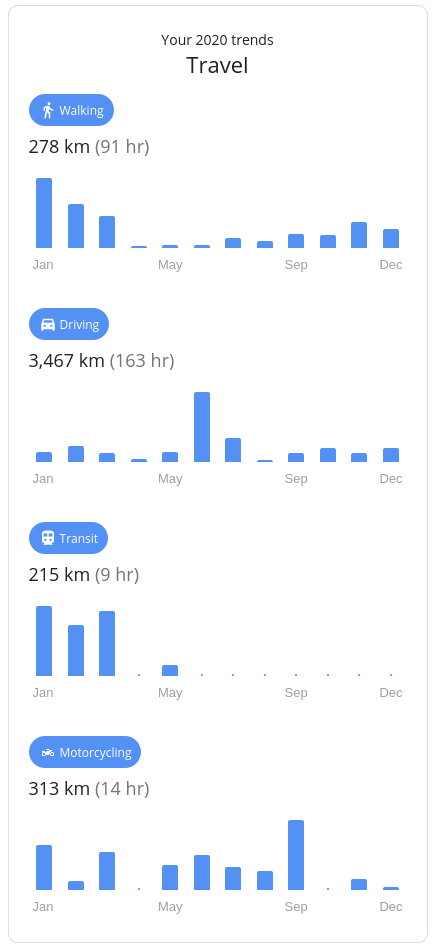
We can also see how bad it was when we look into the Google location timeline:
I would love to say that June was nice because I went out driving (yes, I even have a car now, it is very useful now) more but it was just like that because I went to the ICU every day to see how our babies were evolving in the incubator.
Weight
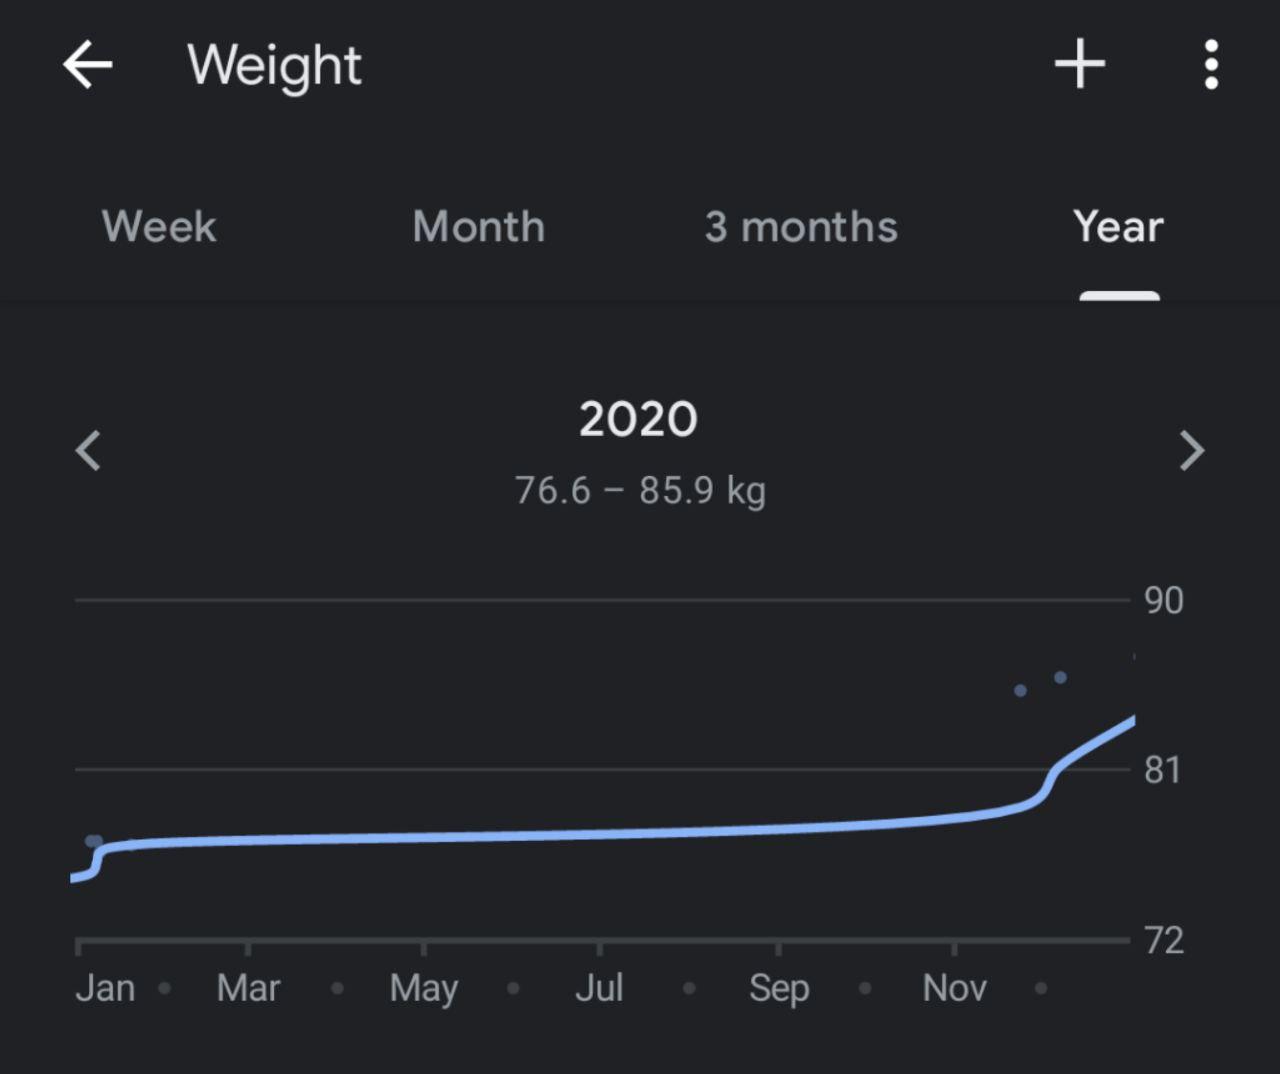
OK… Weight tracking, where do we start? It was a very bad year for this matter. I had plans in the beginning of the year to be fit before the babies were born because I knew it would be quite hard for me to maintain any sort of exercise routine. My plans did not consider any pandemic, of course.
With no gym, no physical exercise, a breastfeeding wife that can eat anything without gaining weight (it takes a lot of energy), and a very exhausting routine to take care of two babies, the result couldn’t be good. I gained more than 10kg last year. The chart doesn’t say much because I didn’t have any reason to keep tracking my weight I just gave up for a while. This is my current (February 2021) weight data:
You may check in 2019 that I was doing great with my gym routine and had great improvements. All of this is gone already.
Sometimes we have great things to show, sometimes we don’t. I’m not an Instagram model showing the best of myself, I’m doing this to understand what is going on. This time, things are a bit ugly. It will not be like that forever though, this is something I want to improve soon. Hopefully, it will be this year, but if not, it will be 2022.
I just need to have my weight under control instead of always increasing. This is something I’m going to do in 2021.
Sleep
This is one of the sections I was very curious to check. As a father of twins, you can guess I’m not sleeping well enough and it was totally expected.
I had great data from Sleep as Android last year but this time I don’t have it anymore. I didn’t take sleep as Android seriously this year and factory reset my phone at some point. I thought I had backups for this data but I was only able to restore the data since last October, which is not very useful for this review.
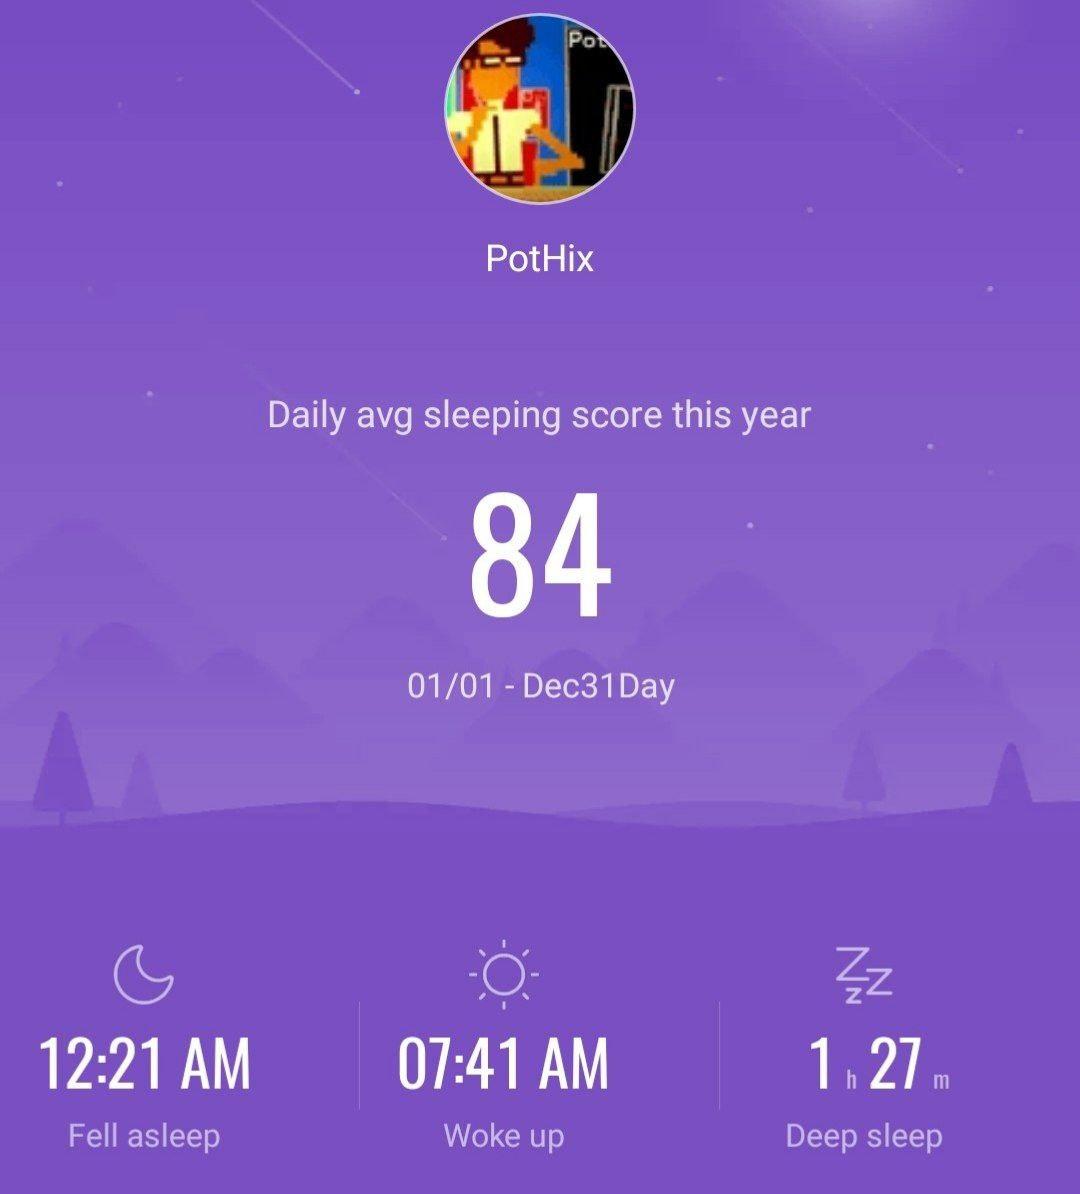
Let’s see what Miband has to tell me about this:
The average score (whatever this means) is a bit less than the score I reported last year and there’s not much change on the full asleep and woke up time. The deep sleep is 20 minus less than the reported last year. When looking a gain, I saw I just reported the image for one month last year, so it’s not really comparable.
The average sleep is less than 7 hours this year, compared to 7h30 last year. It was much better than I expected to be honest. Maybe it was because the first half of the year was not that bad.
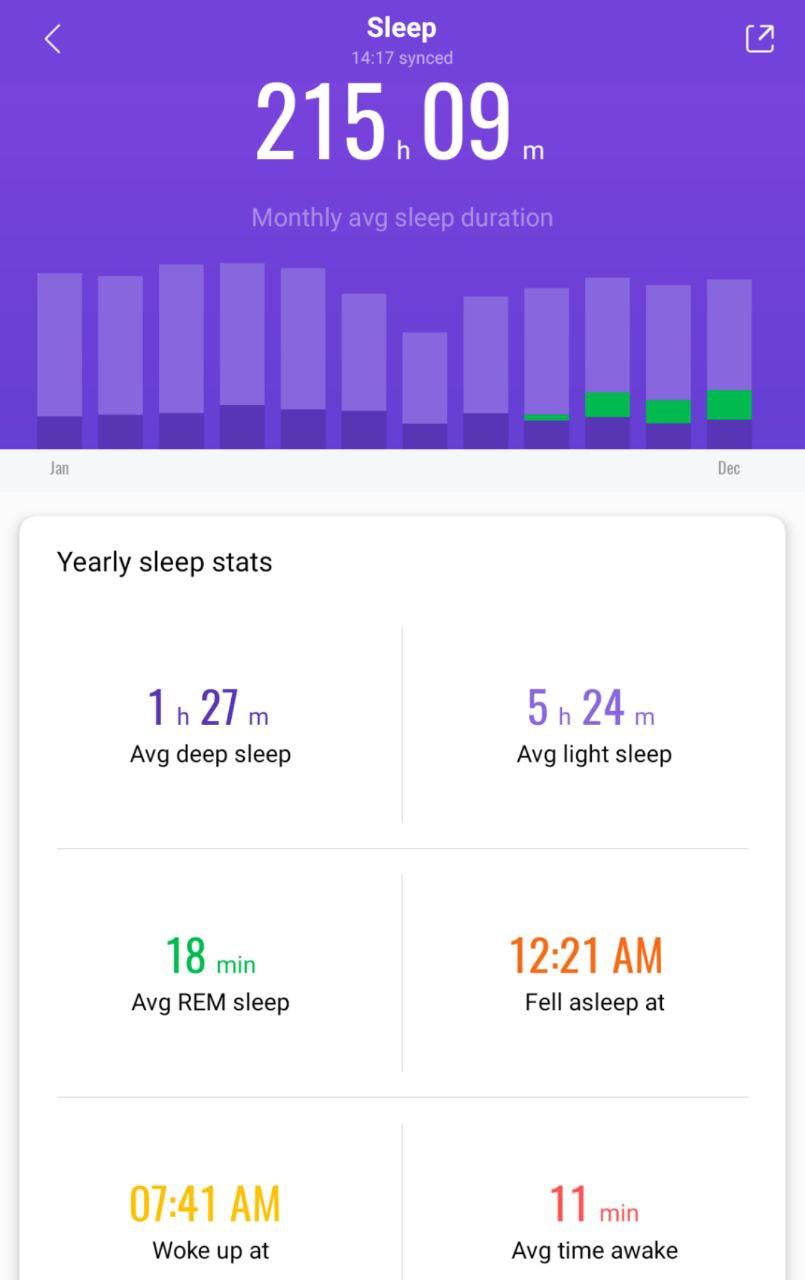
I sync the same data with Google fit and connect it to Exist.io. I couldn’t get any decent data from Google Fit, but Exist provides some good averages:
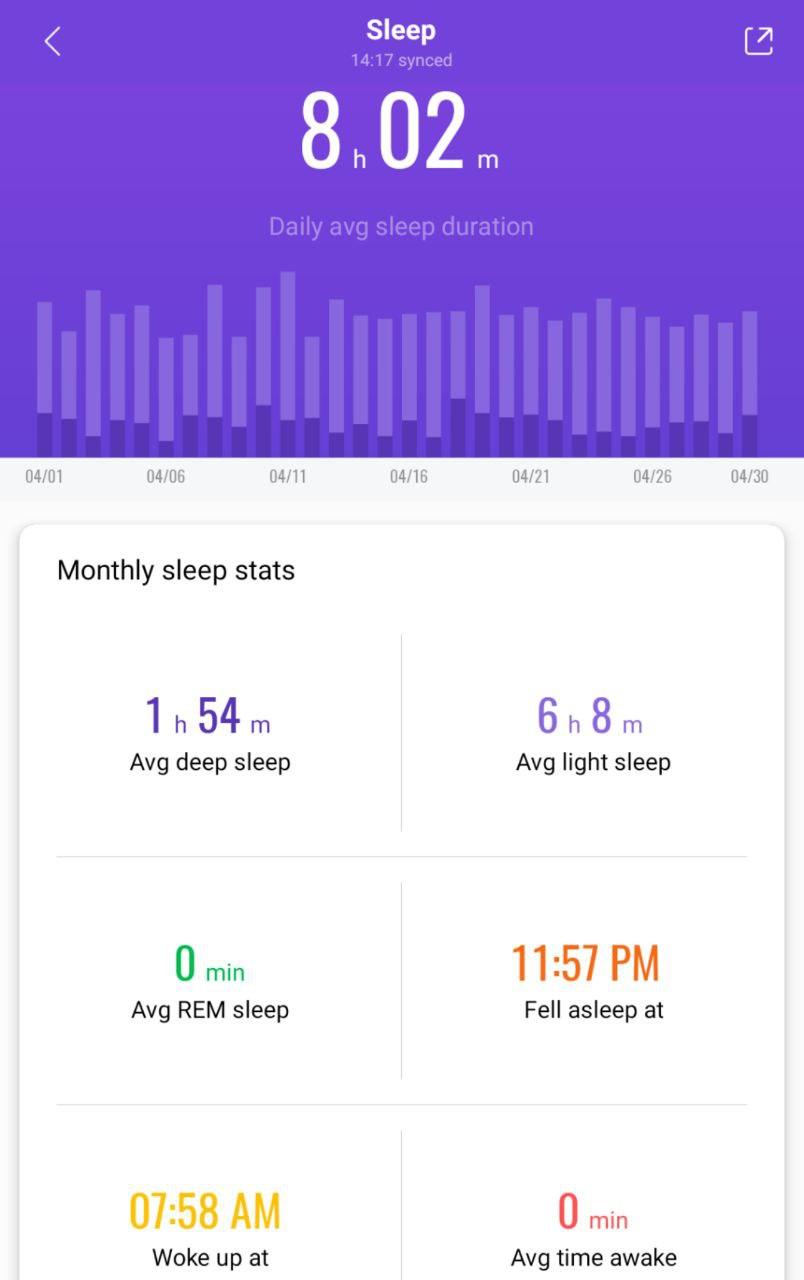
I believe averages do not show the whole picture, especially on the situation I’m in right now. Let’s use pick months as examples to see the difference. This was the situation in April:
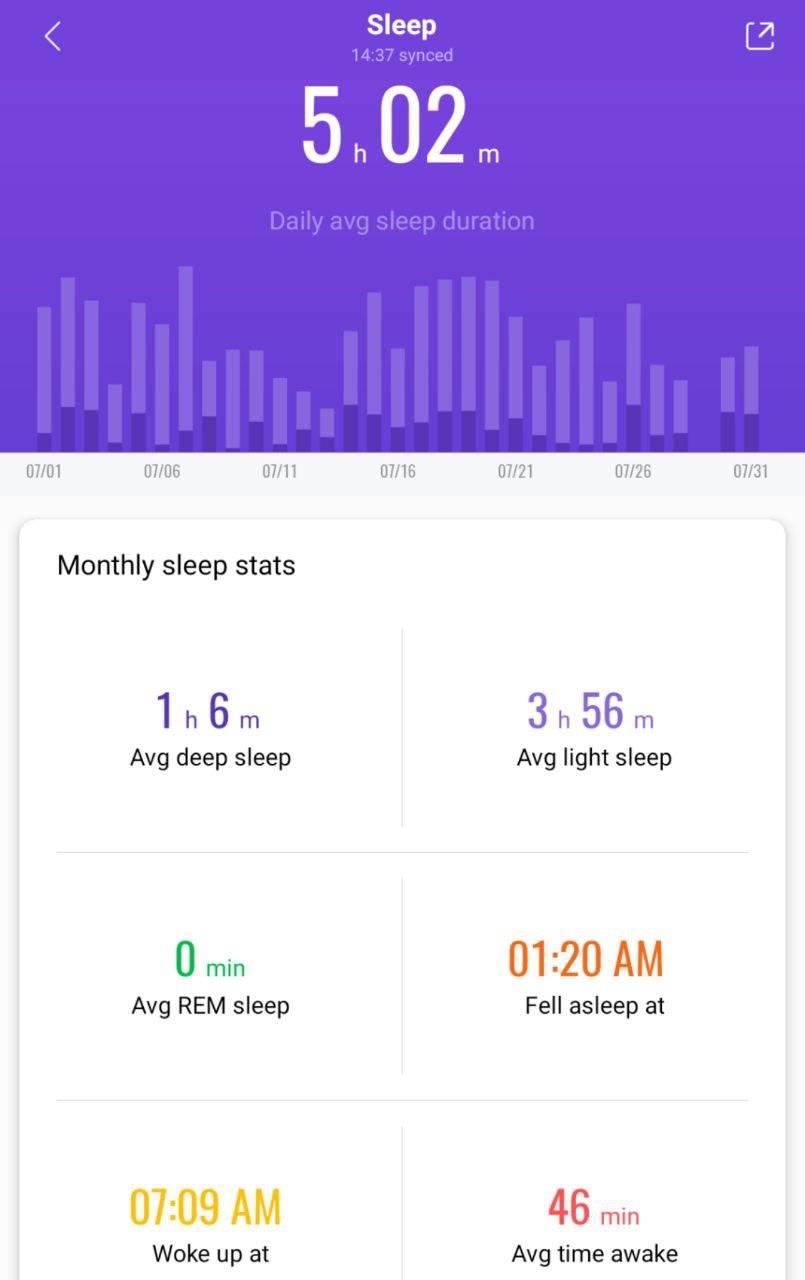
Which looks pretty good. Now let’s compare it with July, which was the worst month in terms of sleeping (when the babies came home from the ICU):
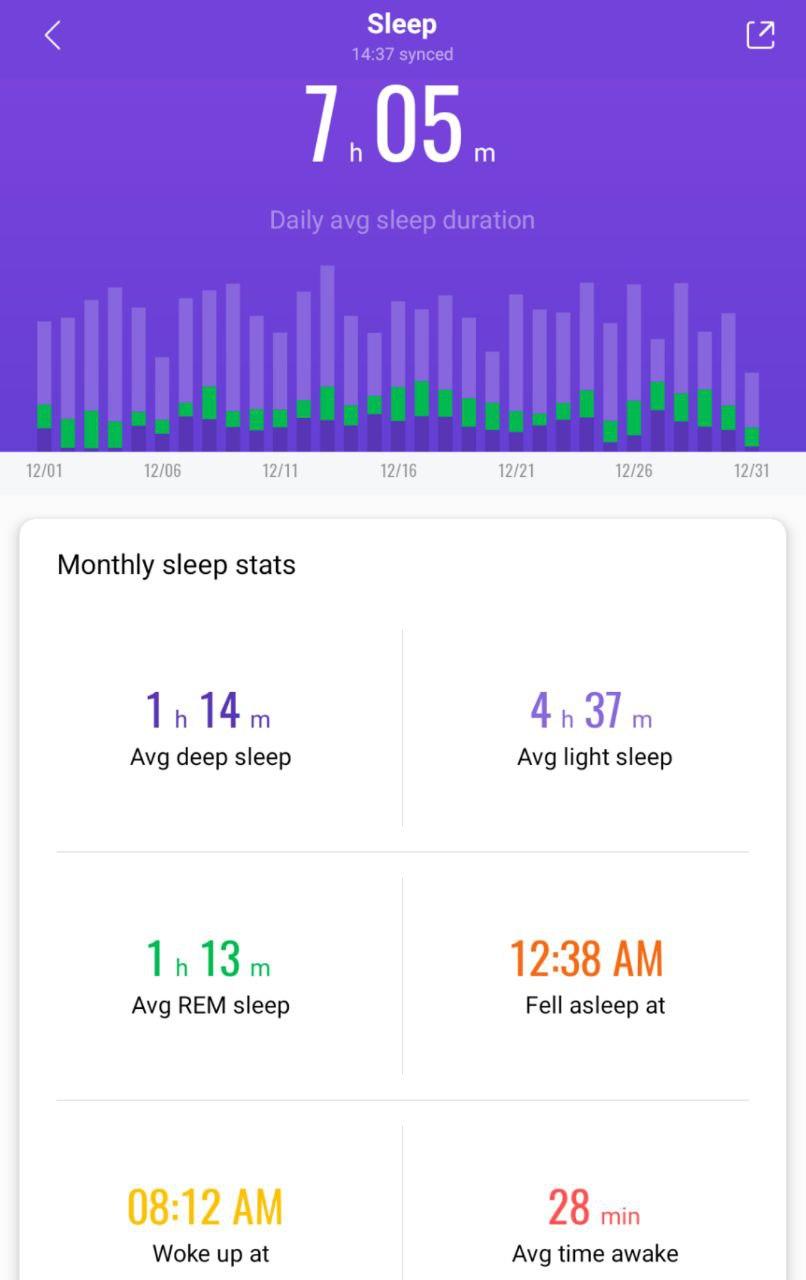
It’s quite different 😅. Things tend to improve in terms of sleep time (not quality). Here is the data for December:
It’s not the best but it’s not the worse either. The problem for us is not the total of sleep but how many times we have to wake up at night and this is hard to track. Currently, we’re waking up ~4 times every night, and it’s usually not tracked.
The chart also shows the avg REM sleep (Rapid Eye Movement), which is something that comes with the latest version of the Miband. 😉
I expected to have far more Sleep data for this year because I knew things would be complicated, but I couldn’t dedicate that much time improve my tracking. The current data is not that bad though.
Locations
This is another depressing topic for 2020. 😞
I had plans to visit Mexico (for Rust LATAM), Singapore (Doist retreat), Swiss (I would stay 2 days in stop over while going to Singapore), Bulgaria (for a possible mini-retreat of my team), but thanks to the pandemic, I went nowhere 😞.
Here is the summary of the year and all-time data by Google:
It’s hard to compare with anything. I visited 18 new cities last year and 1 this year. The new places I visited this year were all before the pandemic start or when I my babies were at the ICU and we were spending the whole day at the hospital, which means we had to go out for lunch.
At least the all time data is still good, it’s not so depressing when I got to the bottom of that report.
Investments and expenses
This is the time I look into all my yearly expenses and investments and plan for the new year. Now looking at my expenses tracking, I’m a bit disappointed. In the past I used a local app (Guiabolso) to track my expenses. The app connects to my banks and unify everything in the same dashboard so I could see charts and all. In the past years, they made the app unusable by adding lots of adds (3/4 of the app are ads now) and remove the yearly charts, which makes it useless for me.
I was betting on my current bank to provide me a good way to see this, but I can see now it was a mistake. They only provide 3 months of data and there is no way to get any charts.
To get decent data now I would have to craft my own Google spreadsheets document and do the charts myself by getting data here and there. This is definitely something I’m not going to do now.
If there’s something to talk about expenses this year is that I have a car now. I’ve been avoiding this for at least 15 years because I know how much money such a vehicle burns (and it was not critical to have one until now). Now looking at how much money I spent in taxes, insurance, maintenance, etc. I was totally right.
Well, that’s it for the expenses. Hopefully, I will be able to share a bit more about my biggest expenses in my parenting section.
Investments
I did some migration to use dlombello’s spreadsheet to track my investments last year (pt-BR only). I’m still concerned about the fact that you have to give full access to your Google account for it to work (because of external scripts) and I still maintain a Google account just for that.
With that said, the spreadsheet is amazing and I’m using a newer version compared to the one I used in the past year. Let’s see how much data and charts I can extract from it. The images will be in pt-BR, since there’s no English version of the spreadsheet.
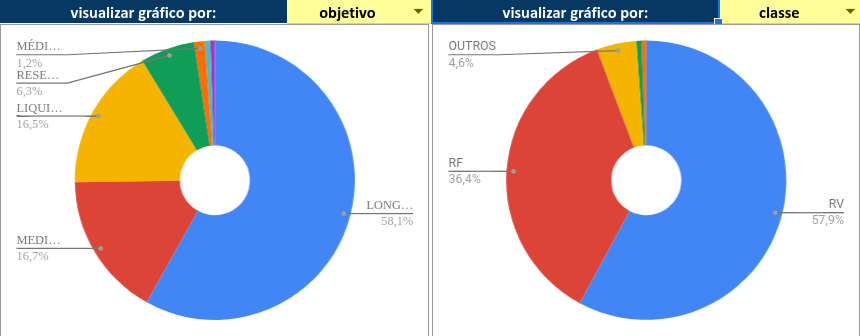
This is my current portfolio:
RV means stocks + some other risky funds (this is my categorization) and RF is bonds. I changed it a lot this year. Last year, most of my investments were in bonds (~80%) but it requires changes with the current economy.
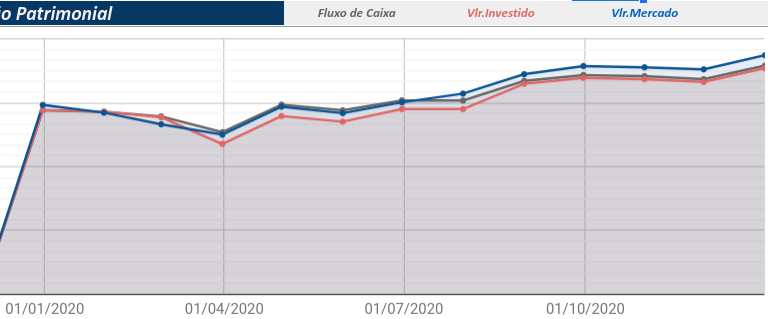
My portfolio had some good growth this year:
Sorry for not showing the scale but there was no percentages there, just the actual value and I have no intention of making it public.
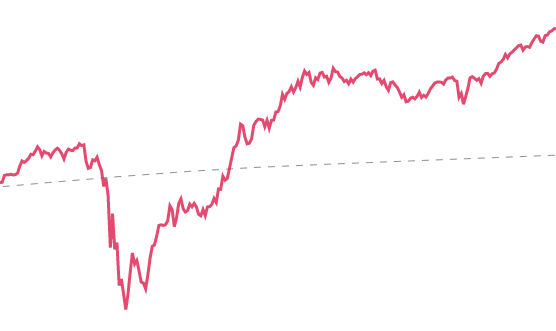
I’m starting to not trust these charts because my main broker (holds 60%+ of my investments) has a very different data:
I trust my broker because I’m following the situation there in a monthly basis, while I’m not checking the spreadsheet charts every month.
My entire portfolio grew 18.53% compared to 23.87% growth last year. I see a trend having less and less percentage of growth, but that makes sense if we consider the amount is larger every year (to get 100% growth of $10,000 is much easier than getting 100% growth of $100,000).
The growth happened mostly because I was depositing more money, my investments this year had a very poor performance. I happened to have -30% during the pandemic but it recovered throughout the year.
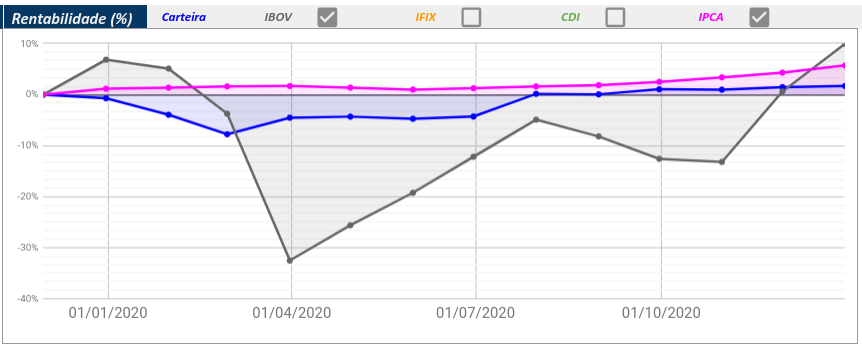
According to the spreadsheet, my portfolio growth is lower than our inflation index but is less volatile than the stock exchange index:
This is a very bad sign. If I’m not beating inflation, I’m losing money. I’m a bit skeptical about this chart because my main broker says I got ~14% ROI this year. Maybe this is happening because my main broker holds the riskier part of my portfolio and it’s yielding more returns compared to the rest, which are more conservative 🤔. This is definitely something I want to check and improve this year.
Considering this new plan and the whole year of 2020, I have 89.40% of my goal. I know it’s weird to just introduce this value without further background, but just wanted to keep it here for my future self.
Given the current circumstances and my life choices, this goal will have to change this year. I’m OK with these changes, it’s important to have plans but it’s also important to change them if the circumstances require such change IMO.
This was an intermediary goal for financial independence and it considered a different way of life than the one I have now. I’m currently a father of twins and this changes everything from now on.
My plan was to wait a bit more and understand my expenses so I could draft a new plan (for FI or for anything else), but I don’t even have time to go to the supermarket at the moment, no chance to sit and write such a plan yet. I hope to do it this year and get back on track with my life plan.
Parenting
It’s finally time for a new section here. These are not metrics about myself directly, but they certainly influence me a lot. I wanted to do this since the first time I realised I would become a parent. The reason for this is… Why not? 😛
I’m using Babytime to track everything happening to the babies. I don’t have to justify anything, but it’s not just a matter of writing this post, but also for us, parents, to understand what is the situation during the day and night. When you’re taking care of twins, you have to be sure what baby you did something last time. More than once we asked ourselves: “Did we do this medicine to our boy or our girl?” the app was very helpful with that.
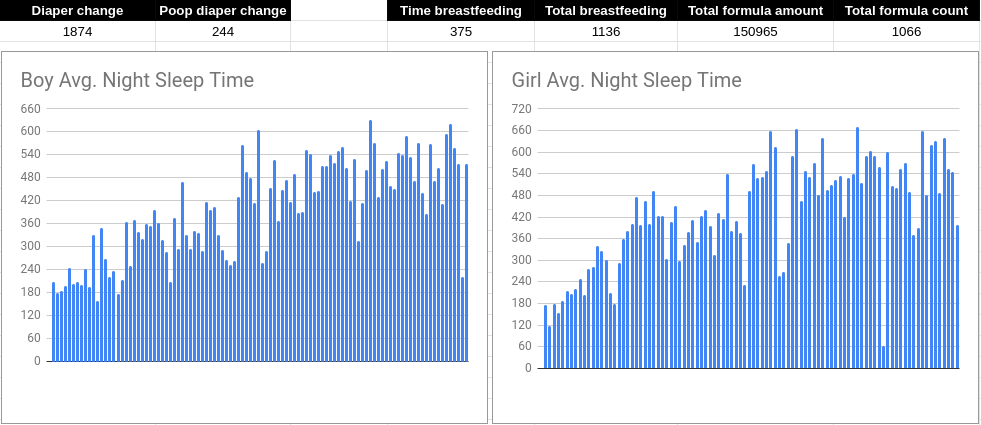
The app mostly offers charts in a weekly based because this is usually what you will need. They also offer a way to export monthly aggregated data, so I downloaded all months in 2020 for both babies and imported in Google spreadsheets. With the data there, I did some simple formulas and charts:
Let’s break down the data of this image even more.
Diapers
We changed 1874 diapers in 2020, 244 of them were poop diapers. I was surprised by this number because I was expecting much more. I’m wondering if it was a problem with our manual tracking or my memories of these times are not very good and it seems to be much more. 😂
If we changed 1874 diapers, we can consider 1900 diapers used (sometimes you do it more than once in a row). We also use wet wipes, every time we do the change. From the top of my head, I would say an average of 2.5 wet wipes every change.
As a cross-section post with expenses, the average best-price for a diaper (the one we use) is R$ 0,67 and the price for one wet wipe is R$ 0,13. That means, we spend R$ 1 for every change (0,67 + 0,13*3). That means I spent ~R$2000 in diapers in 2020.
Milk
My wife spend 375 hours breastfeeding last year. It’s a total of 1136 times, breastfeeding.
We take turns in who will receive breastfeeding and who will receive formula. We gave them formula 1066 times in 2020. It was a total of 150965 ml or ~150 liters of formula.
It’s nice to see they had more breastfeeding than formula. We try to prioritize breastfeeding whenever possible because of its benefits.
I’m trying to measure expenses in formula but it’s not so simple because there were different formulas this year, some were very expensive (25% of a minimum wage each) because of a condition our girl had. It’s so expensive that the government provides this if you’re approved. With that said, I would estimate ~R$3000 in formula in 2020.
Sleep
This is something I was also curious to see the results. Looking into the chart, we can see things improved a lot since they came home. In the beginning, we had to feed them every 3 hours, but after some time, they started to sleep much more at night.
The chart is in minutes and I decided to not apply any transformations to the data. I used the step after every 60 minutes, so it’s easy to count hours.
By looking at the chart, I can say they are sleeping an average of 7 hours every night. Of course this is not without interruptions (who would even consider this, right?), we wake up many times every night to do stuff. I would say it’s usually 3-5 times in total (considering me and my wife).
It usually doesn’t take much time for us to get back to sleep. It was very few times that we had to wake up and stay awake for 1+ hour.
Growth curve
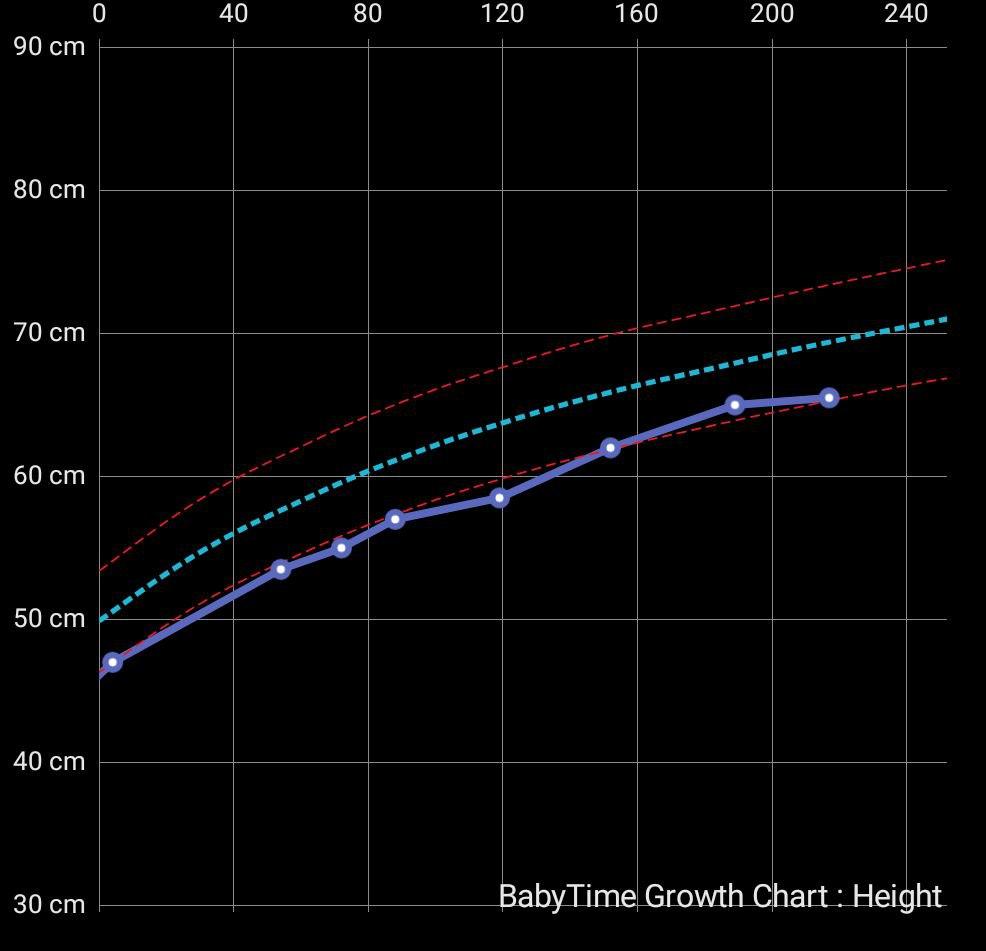
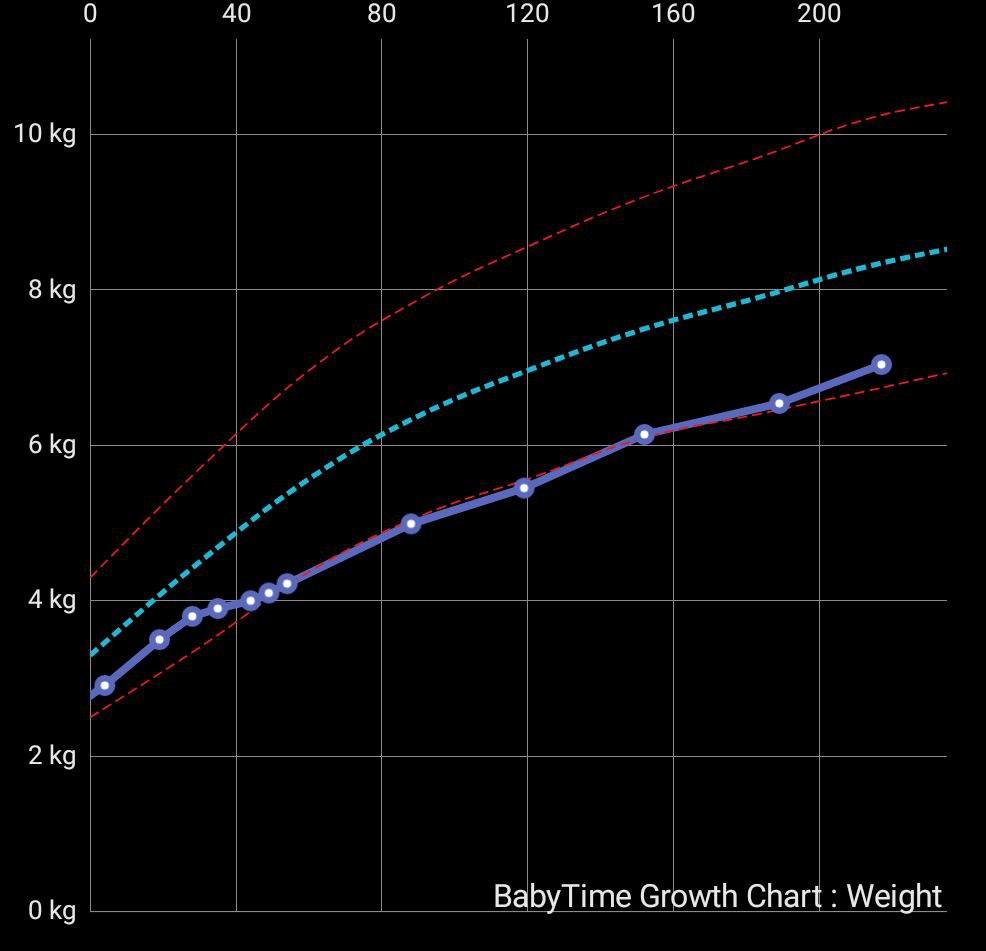
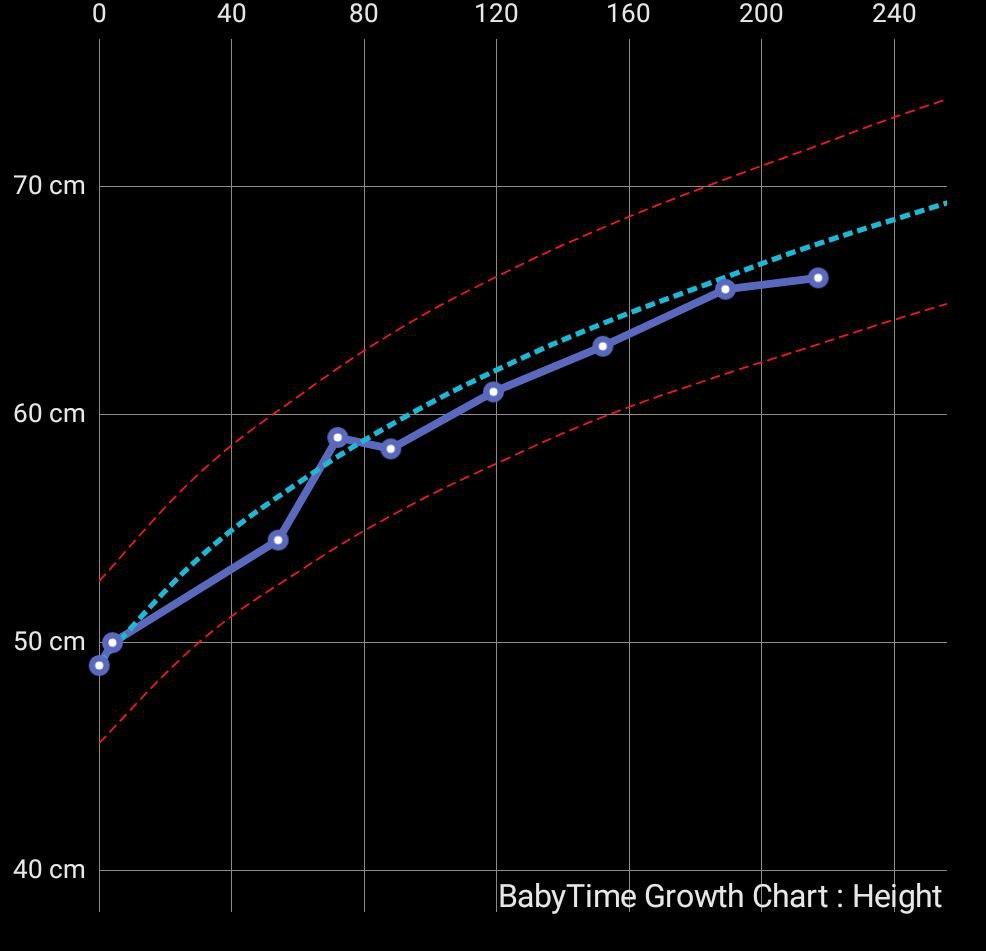
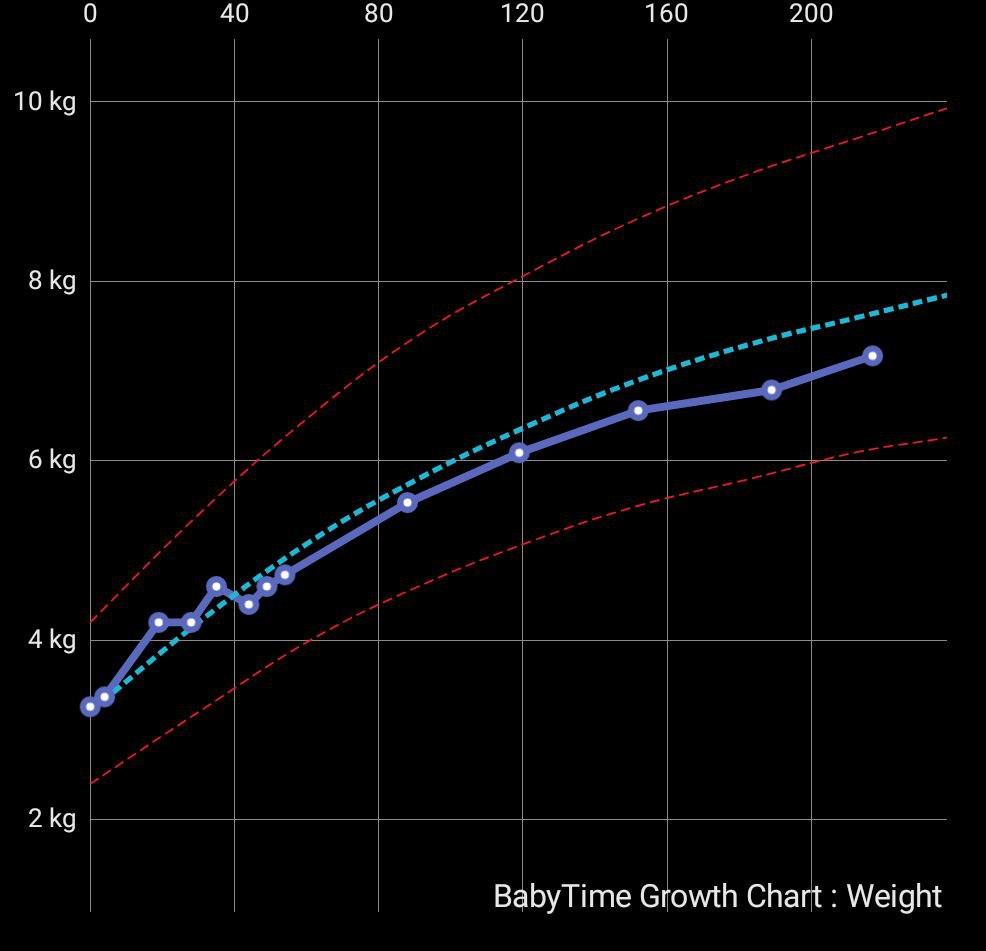
Our babies were born prematurely (that was the reason why they spent 40 days in the neonatal ICU), so I’m following their growth curve since the beginning. :)
The app provides good images for this, so let’s see the one for our boy:
He is at the bottom 3% percentile of the curve for weight and height but it’s not a big problem if he maintains this pattern and do not degrade.
And now for our girl:
She is a bit more close to the 50% percentile, I would say she is at ~40%.
Time to write this blog post
It’s time to wrap up this. 💪
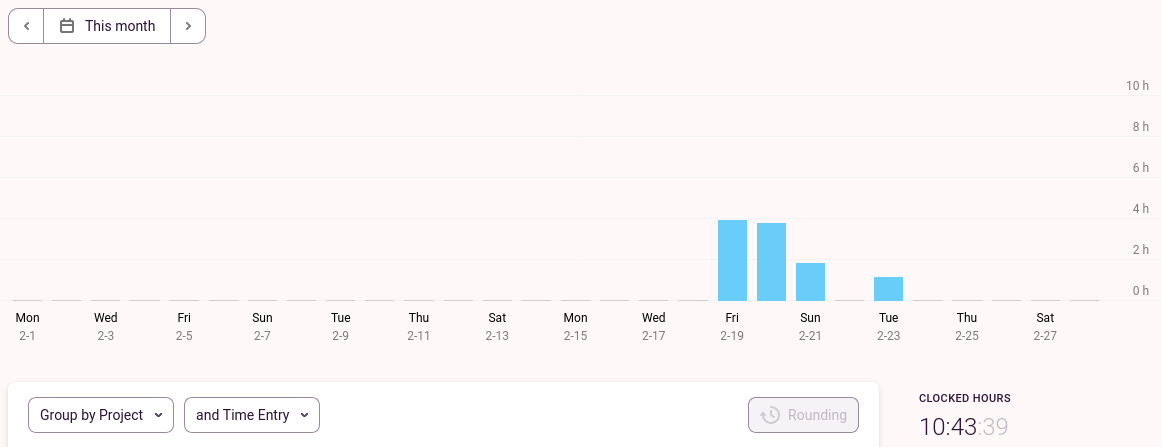
I tracked the whole writing process and it took 10h43min to write this blog post.
I usually expect it to take ~10 hours, so I’m happy with the result. Once again, it totally worth my time to write this. I have so many good insights when reviewing the data I collected. 😌
Conclusion
It took much more time to write this comparing to previous years. We are almost at the end of February and I realised I had to post it now or it wouldn’t make sense anymore. To make it work, I had to do it at night, while both babies are sleeping. I was almost convinced I would not have the time to write this. There was a time I couldn’t write this because I prioritized taking a bath at 00:30 before going to sleep. It’s not easy, but this is my life now and I’m getting used to it.
Last year I said I had nothing to complain about the years I reviewed, but this time I have a lot to say about 2020. It was definitely a hard year for me (and for everyone else…). Hopefully, 2021 will be a better year.
Writing this review made me realize the good parts and also what has to change somehow. In general, it was more positive than I thought tough. 😊
