24 minutes reading | Também disponível em 🇧🇷
2019 Year in Review (full of metrics!)
Brace yourselves, like any other stats post, this one will be HUGE
My year in review for 2018 was never posted because I could never finish it. I don’t want to let the same thing happen this year, so here I am.
The end of 2018 and the beginning of 2019 was quite hard for me and me just didn’t have the energy to sit down in front of the computer during the weekends to write my monthly reviews.
Some people still ask me to get back to write such reviews, but I couldn’t make this a priority for myself anymore. I don’t want the same to happen to my Year in review. I do it for many years already and I plan to keep doing it for a long time. So let’s start!
Average day
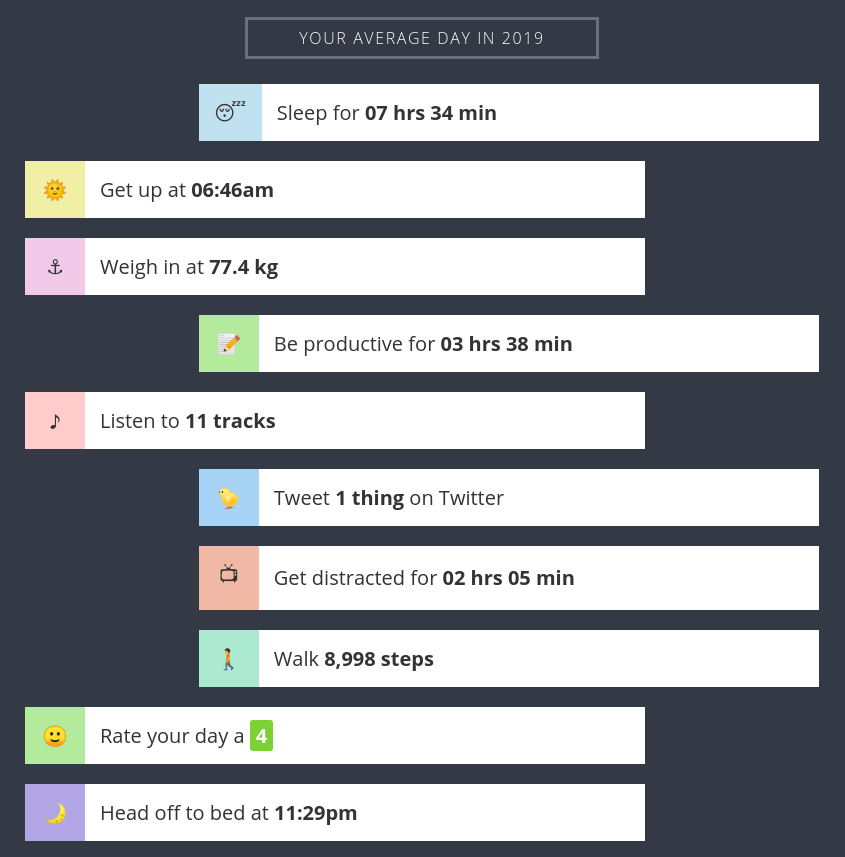
Let’s start with what an average day is to me according to Exist.io:
This is almost a TL;DR of this post, but there’s a lot of details missing here and we will cover them topic by topic. 😉
Books
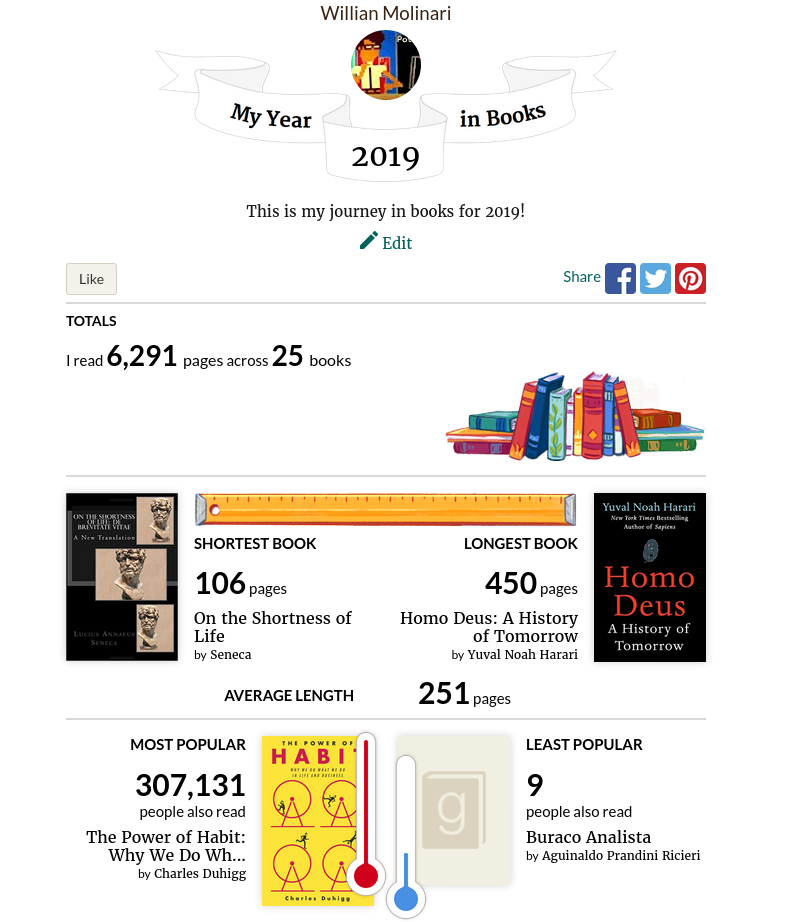
Although I did not meet my goal of 30 books read this year, I still consider the 25 books read an achievement.
At some point, I realized I was choosing my books to meet the goal. When picking a new book from my wishlist, I was choosing the smallest ones first, not necessarily the ones I wanted to read the most. It’s not that bad, as I was still choosing books from my library and wish list, but I don’t want to have such influence in the titles I pick.
25 books is a great mark IMO. You can see my 2019 Goodreads challenge here. :)
I’m still using Google keep to take notes of all the books I read and I’m posting Goodreads reviews for them based on these notes. You can see the reviews for 2019 by clicking each book on my Goodreads page.
Here are the books from this year’s list that I really recommend reading, with links to my review:
- Why We Sleep
- Homo Deus
- The Power of Habit (second time I read this one)
- Atomic Habits
- Deep Work: Rules for Focused Success in a Distracted World
There are also some from 2018 since I did not post my Year in review last year:
You can always look for my whole list of books read in 2019 and 2018 on Goodreads.
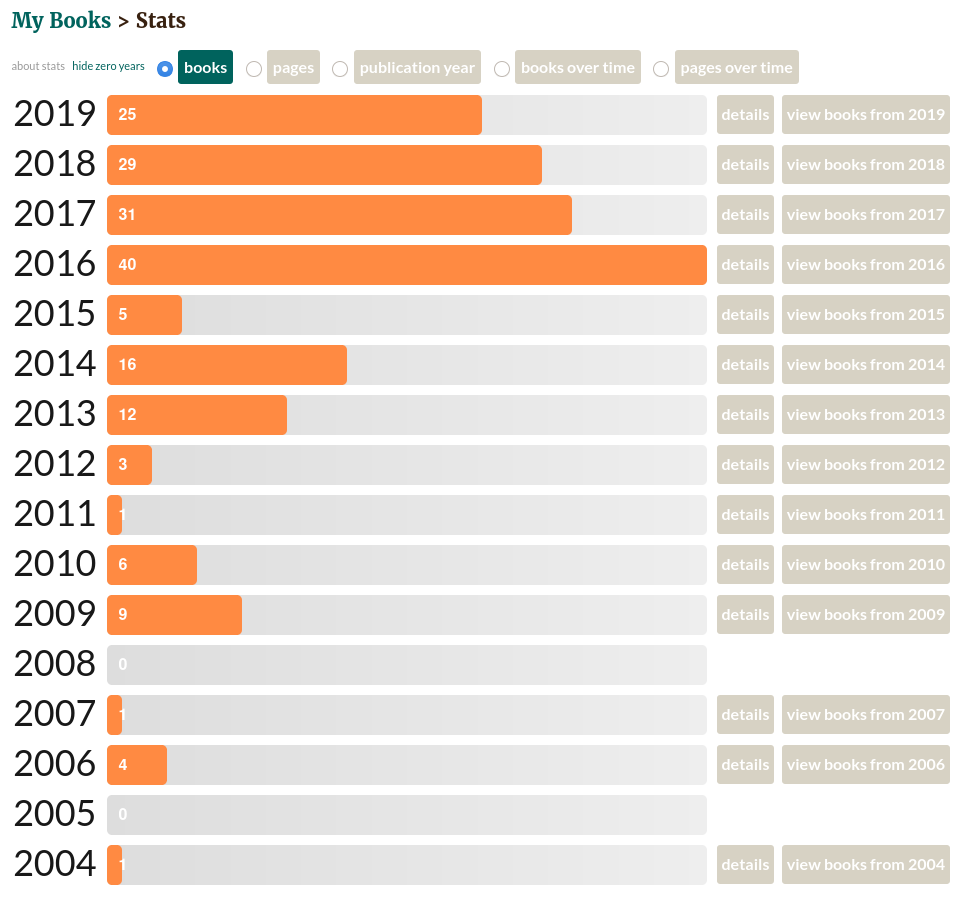
Here are some stats provided by Goodreads comparing all the books I have registered:
I started listening to audiobooks in 2016 and we can clearly see how excited I was. 😅 I can see now that I’m reducing the number of books I’m reading every year, but I don’t think I should be concerned about that. The number should not surpass the quality of books and how much I’m applying what I learn.
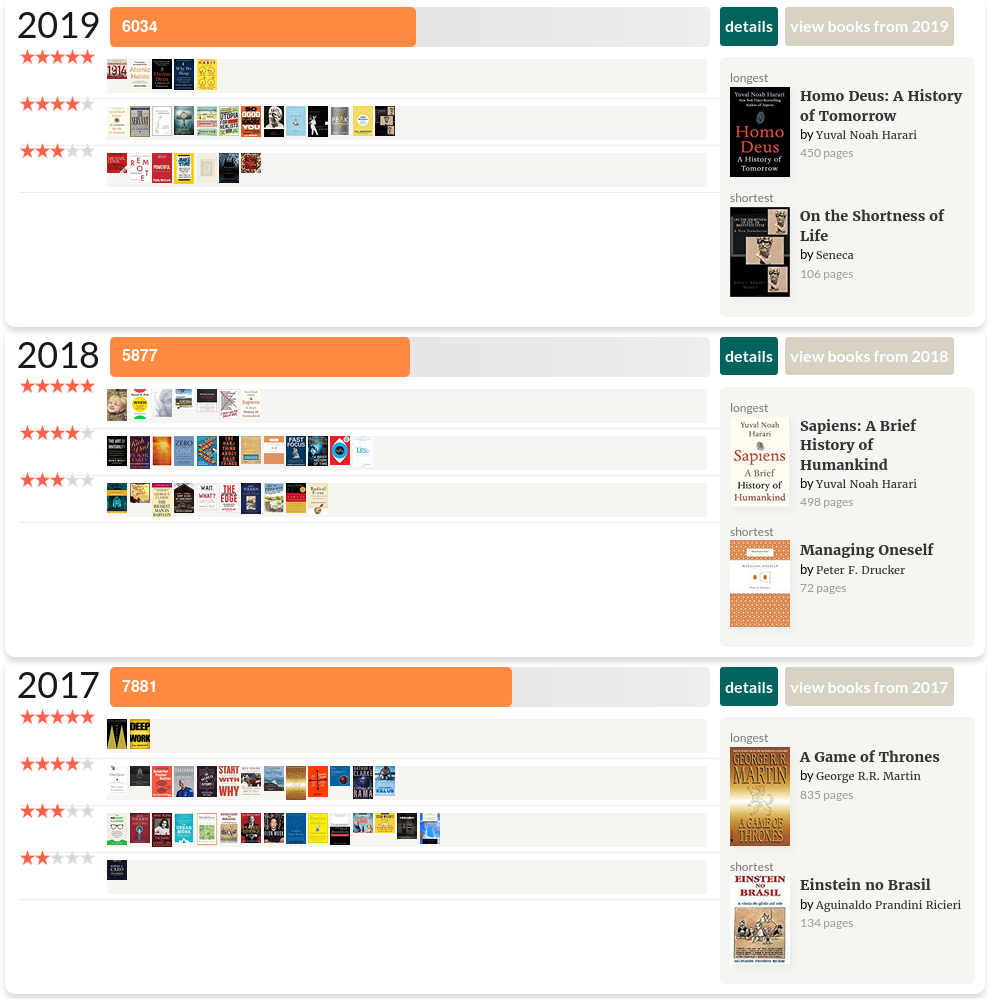
Let’s compare the books I read this year with last year:
I used the number of pages because it clearly shows that I even read more than 2018, but not more individual books. I was not expecting that but it shows that I was trying to be less focused on the number of books.
In 2017, I mentioned that I was disappointed with the number of 5 stars I gave. It was probably related to the fact that I was buying cheaper books and focusing on smaller ones as well. In 2018, I tried to fix that and it works. I gave 7 five stars reviews in 2018 and five in 2019. It seems these metrics were useful after all. :)
In 2018, I read 2 books from my “audible-deal” shelf and in 2019 I read none. From all the books I have on my “audible-deal”, none of them were 5 stars. This is probably a bad sign. On the other hand, I found some great books there and I don’t regret reading them (Spaceman, Rendezvous with Rama, What Doesn’t Kill Us, etc.).
I was not feeling so good about the number of books I read this year, but after writing this section I’m feeling much better. I’m happy with my results here. :)
Articles
I couldn’t finish my year in review for 2018, but the part about articles was done, fortunately. There’s no way to get the read date from Pocket, so if I want to collect it, I have to do it from time to time. Thanks, past self! It was not in vain after all. If you’re reading this, I was successful in publishing this time, so this is good news. 🤞
Different from the review I did for 2017, I will now have data for the full year. I will also mention the data I had for 2018, since they were collected but never published.
In 2018, I had 1733 articles unread (22% increase compared to 2017) and 1456 articles read (31% increase compared to 2017).
In 2019, I have 1908 articles unread (9% increase comparing to 2018) and 1731 articles read (16% increase compared to 2018).
It means that I read 275 articles this year. It’s a bit worse than 2018 when I read 381, but it’s still a good number IMO. It’s an average of 23 articles each month. Again, it’s worth mentioning that I’m aware that I will probably never read all those 1908 articles left in my Pocket account and I’m OK with that.
I was expecting to have more data from Exist.io regarding articles this year, but unfortunately, it was a bit disappointing to not have much. They provided a year in review, which I’m going to mention later, but the only thing about articles is that it says I read 263, which is quite close to the number I had above. :)
Coding
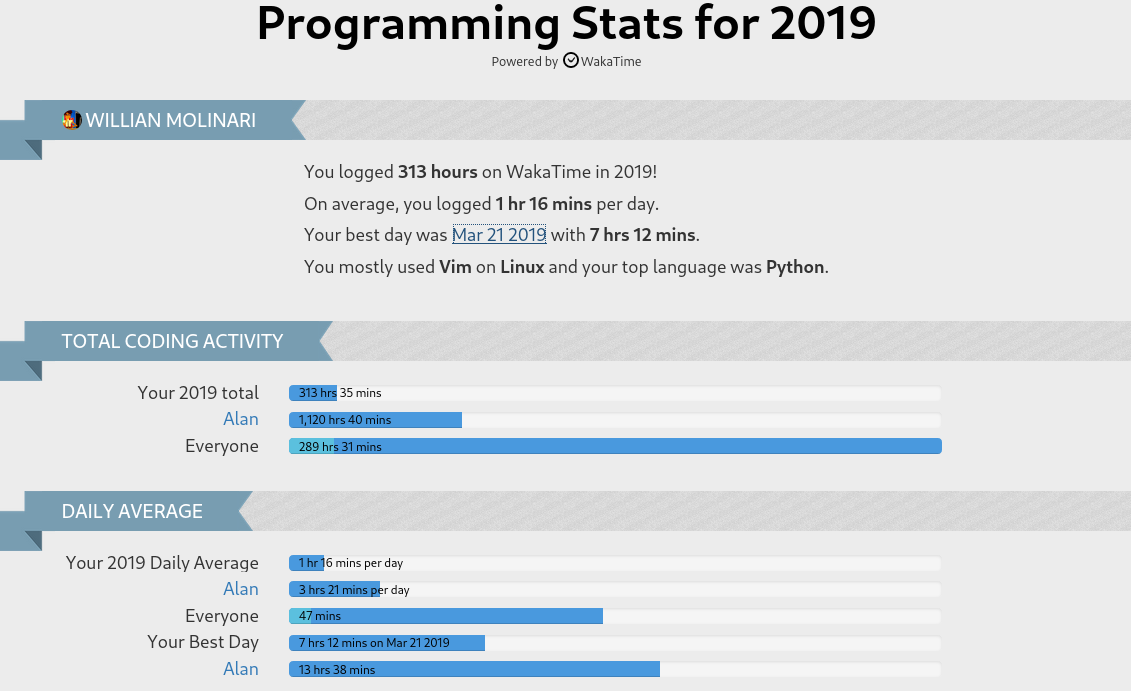
All my coding metrics are provided by Wakatime. When we have a light blue bar inside a dark blue one, it means the light one is the global average and the dark one is the top coder. We should usually focus on the light blue part of the bar.
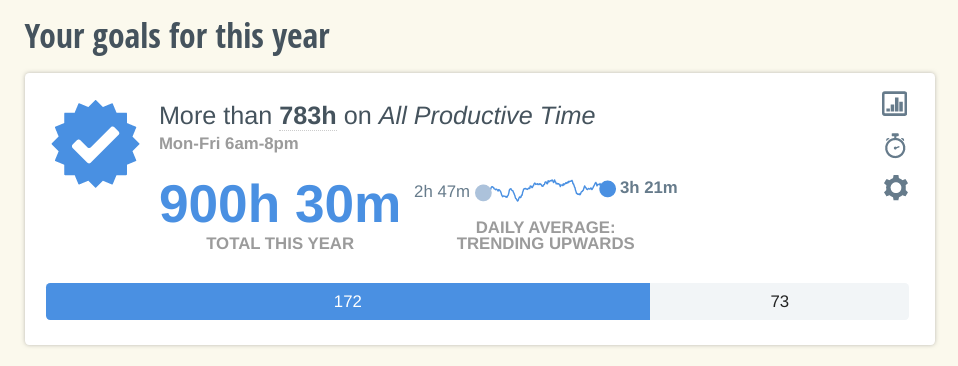
First, let’s take a look at the total time coding:
My daily average this year is even lower than the 1h31 per day I got in 2017, which looks really low for me. I’m still above the average, but 47 mins on average is a bit weird. 😐
I remember the official Wakatime profile added a comment to my 2017 post to mention that it may be related to the way Wakatime records the numbers. I remember tweaking things a bit but I’m not sure if I should increase the numbers to have unrealistic reports. Maybe I should try to tweak the data collection once again.
I dedicated only 22 hours to this blog, compared to 80+ hours in 2017. I would like to improve this, but I’m not sure if it will be a priority, unfortunately.
Todoist is my top project for this year, which is expected since it’s my main job. I expected to have more time tracked there, but I’m not only coding for the main Todoist repository, so it makes sense. I hope to also have Twist as a relevant project on my list of projects next year, or at least have integrations related to it.
I still keep the same freelance job I have for more than 4 years now. It became almost a personal project for me. The good part of working for them is that the work is just coding and mostly fixing bugs. I just need to sit down and write some code.
This year was totally atypical since I took some time to migrate the framework and infrastructure of this project. It was a big challenge, especially for someone working using their spare time for that. I expect the number of hours working on this project to totally shrink in 2020. Let’s see.
I’m just using Linux, so it’s expected to have it here. I’m using it much more than the average as we can see. The “top coder” is an outlier for sure. 😜
In 2017, I wrote: Looks like I fully switched to Emacs. It seems things have changed again. I’m back to Vim now. 🙂
Markdown is still in this list for the same reasons I had in 2017:
- I still write posts on my blog using Markdown
- I’m responsible for Todoist and Twist documentation
- I usually write a long post in Emacs/Vim and then paste them to Twist
There’s no surprise that Python is the language I used the most this year, since we use Python for almost everything at Doist.
I use Ruby at my freelance job, so there’s no surprise to still have it there.
In 2017, I mentioned that I don’t think I will have enough ground to play with Elixir this year but maybe Rust will have his time in my schedule in 2018. It was true about Elixir, unfortunately, but I had an improvement for Rust 🦀. I even had my first change merged into the compiler! The change itself was quite simple, but it was great to understand how to contribute and hopefully, new contributions will come this year!
Speaking
After 2017, I had a hangover of speaking. 😅
For those of you who remember, I spoke 24 times in 2017. I decided to create some sort of a challenge for myself to speak more and was quite successful at it. After such an achievement, I decided to change my priorities. 😃
To make things easier to track, I now have the talks page, which I’m going to use it as a reference here.
- In 2018, I spoke 7 times with 6 different presentations. 6 different presentations delivered in pt-BR and one of them delivered in English.
- In 2019, I spoke 2 times and both were the same presentation. I spoke at the local Ruby meetup and brought that same (slightly changed) presentation to Rubyconf Brasil.
We can clearly see that I’m slowing down my pace of presentations. I came from 24 presentations in 2017, to 7 in 2018, to 2 in 2019. That’s exactly what I wanted to do. I have to say that I was already feeling bad to not be speaking for some time and I was eager to speak in 2019. 😅 I don’t think things are changing much for 2020 though.
It’s also worth mentioning that I was also on stage last year, but not delivering a talk. I was one of the core organizers of Rust LATAM, the first big conference about Rust in Latin America. It was a great experience and you can read more about it here.
Completed tasks
Every year Todoist releases an astonishing Year in review. Here is mine from 2017, 2018, and now 2019, which is the one we’re going to explore.
Let’s check my Todoist tasks! 🙂
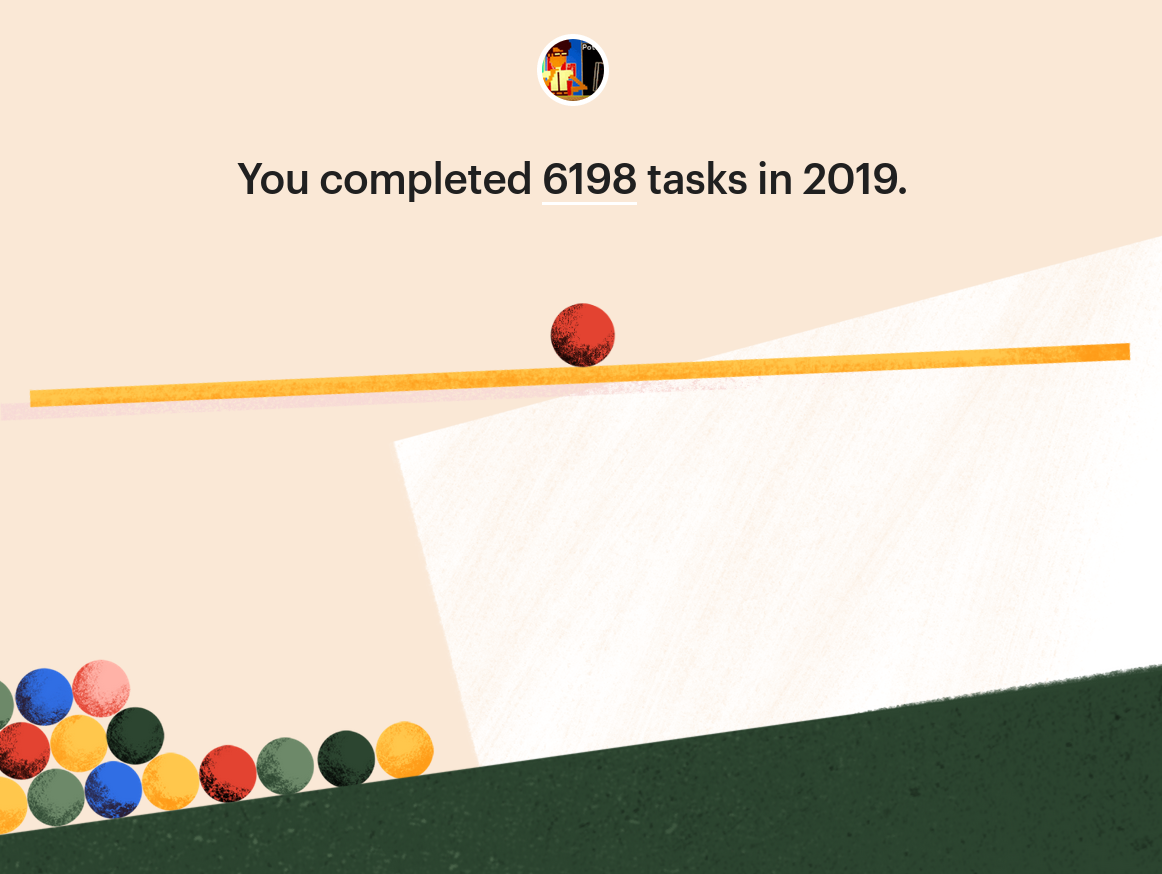
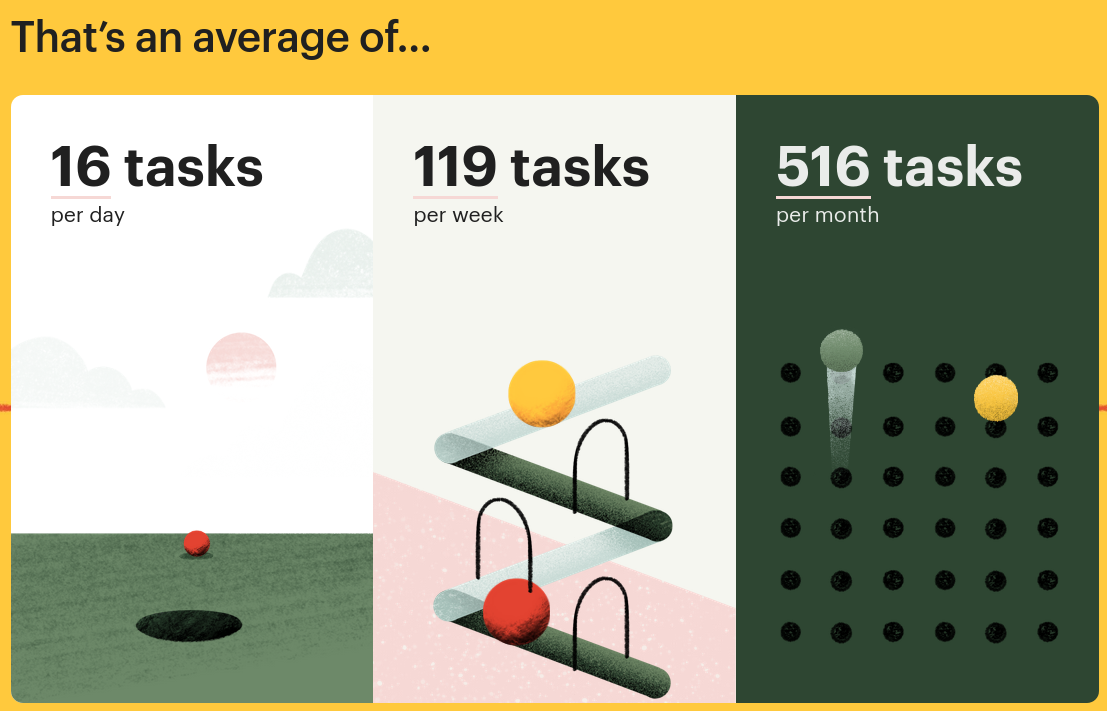
6198 tasks are less than what I expected since I completed 6323 tasks in 2018. It’s not a huge problem because it always depends on how you organize your task manager. In my case, I also have my routine on my task manager so it can help me to actually do the things I plan for myself. The plan for 2020 is to remove my routine from Todoist and move it to my calendar, so I can only have the important tasks there. By removing these tasks from Todoist, I will probably have a report with fewer tasks next year and that’s OK. 🙂
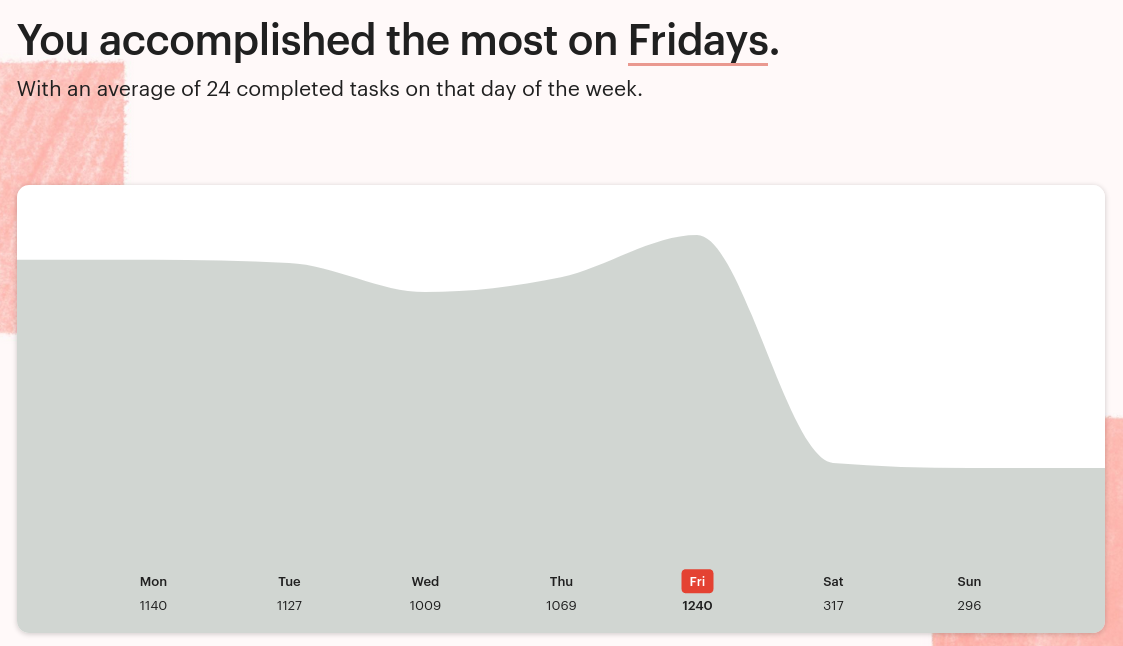
It looks like Friday is the day I complete more tasks:
I think it happens because I usually post my snippets every Friday, so I complete the list of tasks I have to post there every Friday.
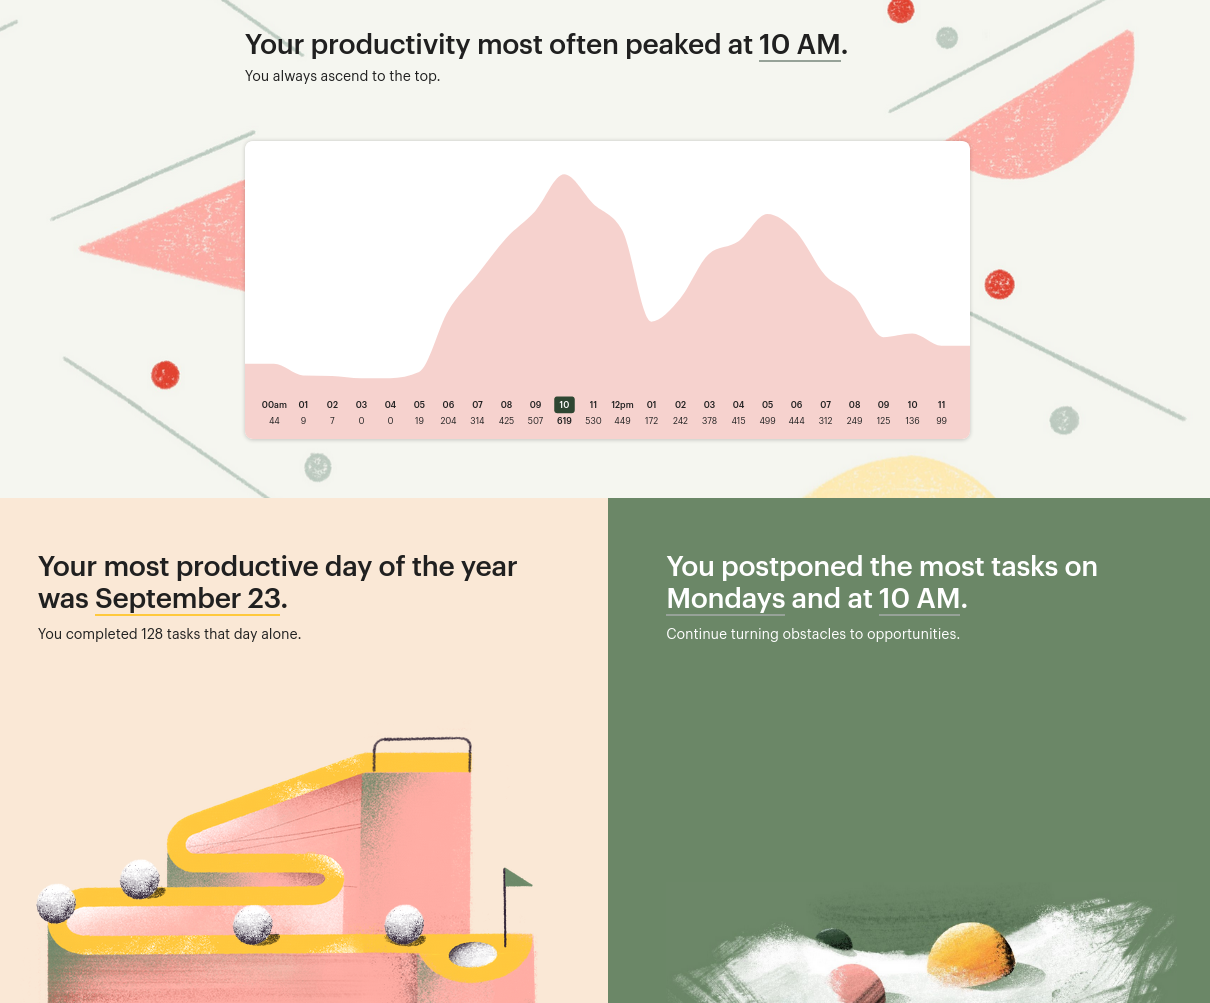
My most productive time is 10:00 (not 16:00 as I had in 2017):
I found it very interesting that the productivity chart correlates with my When tracker (wrote about it on my current productivity workflow 2019):
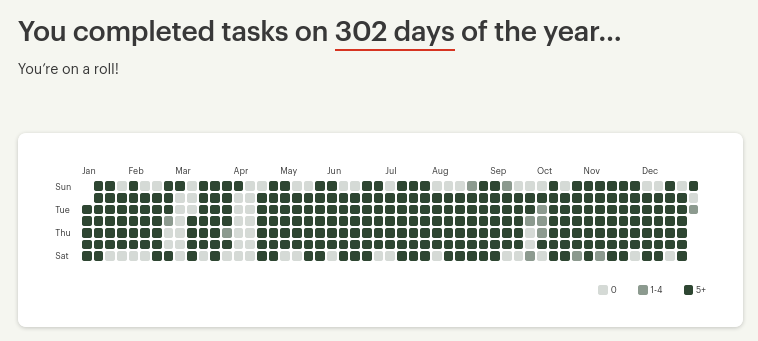
Let’s see how those tasks are distributed throughout the year. You can clearly see my vacations on the light gray columns:
I’m still one of the 1% heavy users of Todoist! 😃
The data and design of our year in review is awesome. I did not participate in the project this year (as I did in 2017), but proud of what we can deliver. 🎉
Podcasts
Unfortunately, I don’t have data about 2018 anymore, so I will just mention 2019 here.
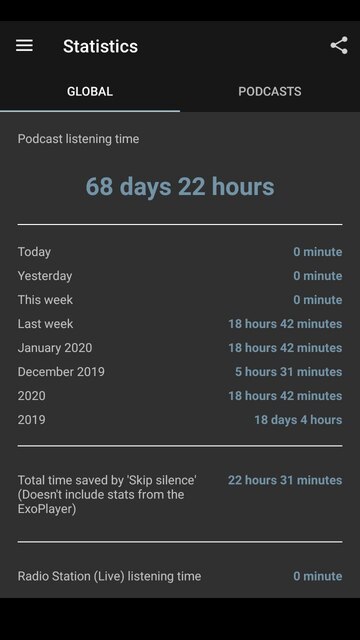
If I was listening to the episodes in normal time (spoiler: I wasn’t) it would be equivalent to 18 days and 4 hours of non-stop listening. As I usually listen to Podcast in 2x or more (depending on many factors), I would say I spent around 9 days listening to Podcasts, which is effectively around 216 hours of my time.
I usually listen to podcasts when I’m commuting, walking the dog, washing the dishes, doing exercises, etc. I’m usually focusing on audiobooks, but I listen to podcasts between one book and another.
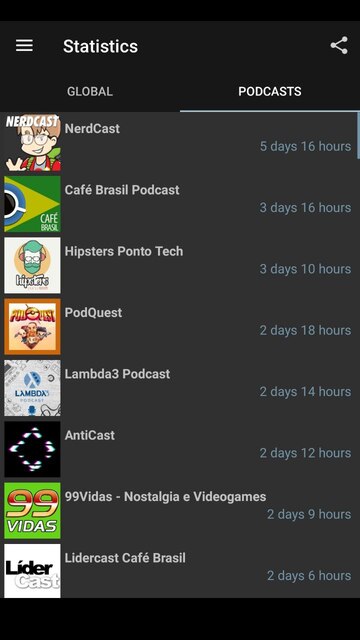
The list of podcasts shown here is actually my global list, not the yearly one, unfortunately. I’m not even listening to new episodes of some of these anymore, but they are still there.
Hours working, focusing and distractions
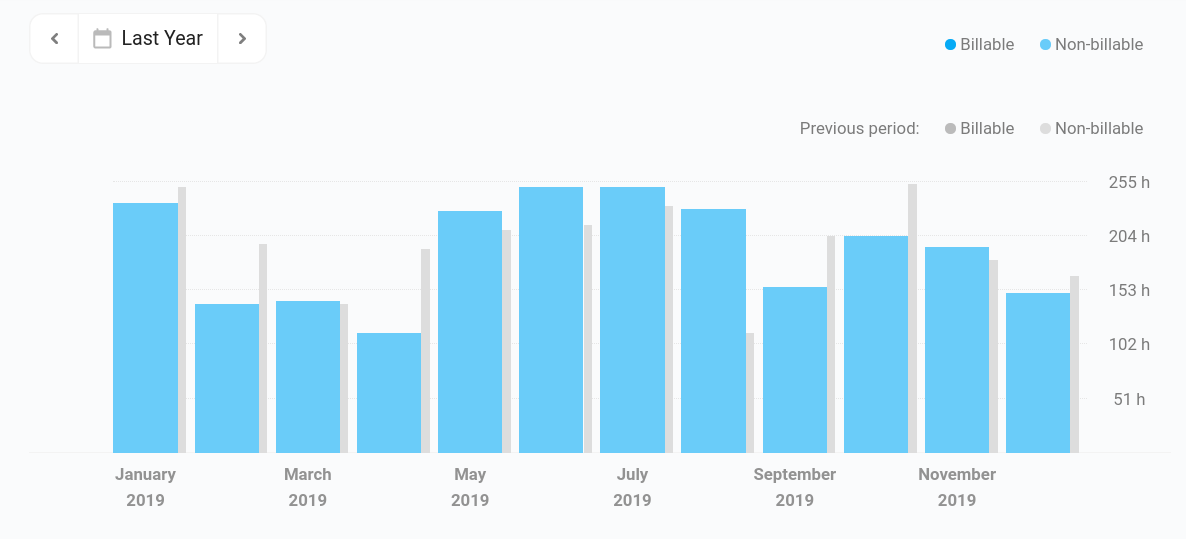
Let’s start checking all my data tracked using Toggl:
The gray bars are related to the data for 2018. I believe the changes are related to my scheduled vacations. :)
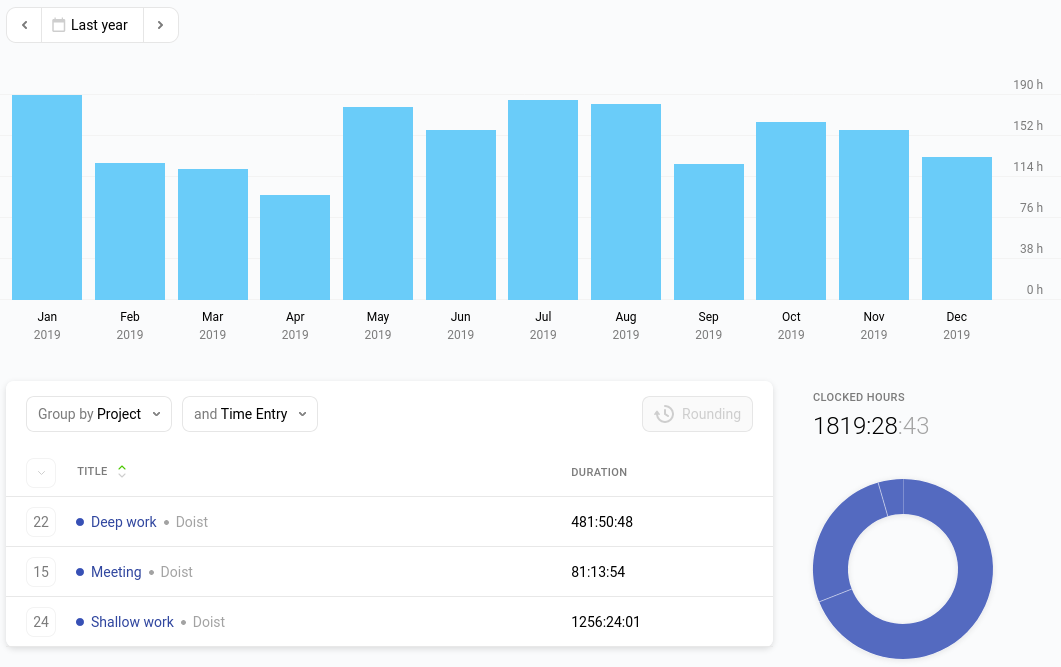
Let’s check my time working, considering my full-time job only:
April was conference + retreat + vacations for me, so it’s an outlier. Considering 40 days of vacations during the year (we don’t have national holidays, they are included in the 40 days) and dividing the average of 151 hours a month by 18 (21 working days - 3 days of vacations per month) I have an average of 8 hours and a half of work every day. At Doist, we recommend to not work more than 8 hours a day, so I’m working a bit more but it’s under control.
I spent 81 hours of my year in meetings. Most of them were weekly sync meetings with my remote team and also a monthly 1-on-1 with the head of my team. I consider all of those meetings productive. There was not a single meeting last year where I found myself wasting my time, so these 81 hours are actually fine.
The most interesting part for me is the Shallow x Deep work ratio. I have almost 3 times less time Deep working than Shallow working, which is not that good. This is totally something I have to improve in 2020.
To give a bit more context, I consider Deep work any work I can do without distraction. Shallow work is the work I do while I have other tabs opened on my browser or while I’m doing something else on the side.
I think I’m not tracking that as I should. Sometimes I’m focused on reading Twist and answering questions, but as it’s not coding, I consider it as shallow work. I will certainly improve it for 2020. 🤞
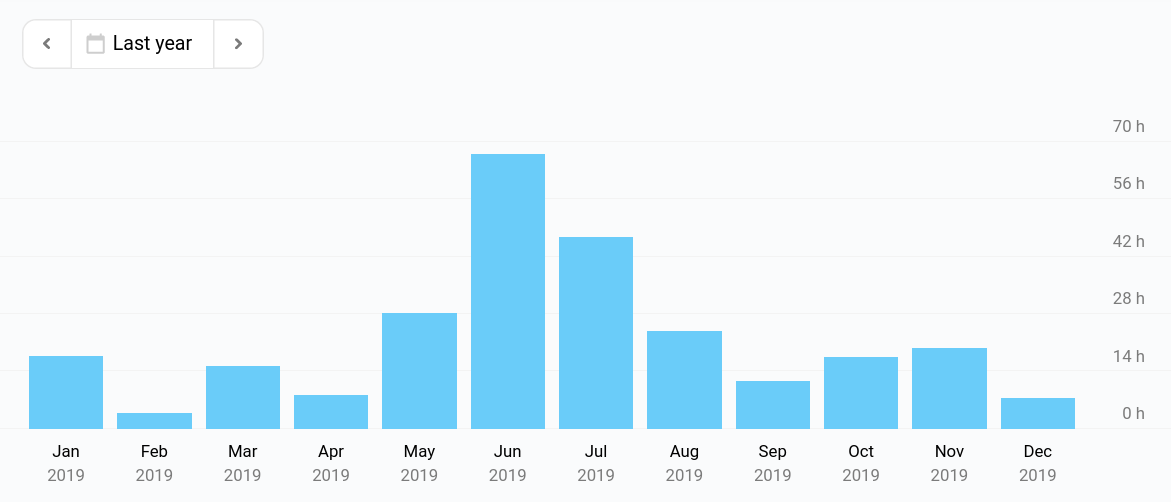
As I mentioned in my previous review, I keep one freelance job, which is almost a personal project for me. I like to improve the app and make it better. I don’t have freelance gigs, but this one I’m happy to keep. Here is the time I tracked about it this year (based on Toggl, not totally accurate):
June is an outlier as I did the migration of the application to a different infrastructure in one weekend. It was an exception as I don’t work during weekends most of the time. As it was my idea to do this migration, it was personal to me. This migration project was the topic of my two presentations this year, as I knew it would be an interesting topic to talk about.
Other than that, I usually don’t work more than 20 hours a month for them. I reserve some time every weekday to work on different things. This project is usually the first in the list, but sometimes I just don’t want to work on it and decide to use my time for other things (tech-related or not).
What I wrote on my 2017 Year in review still holds:
I really like my full-time job (more than ever!) but I like to do different
projects without constraints, it can be this freelance job or other activities
that also brings me joy.
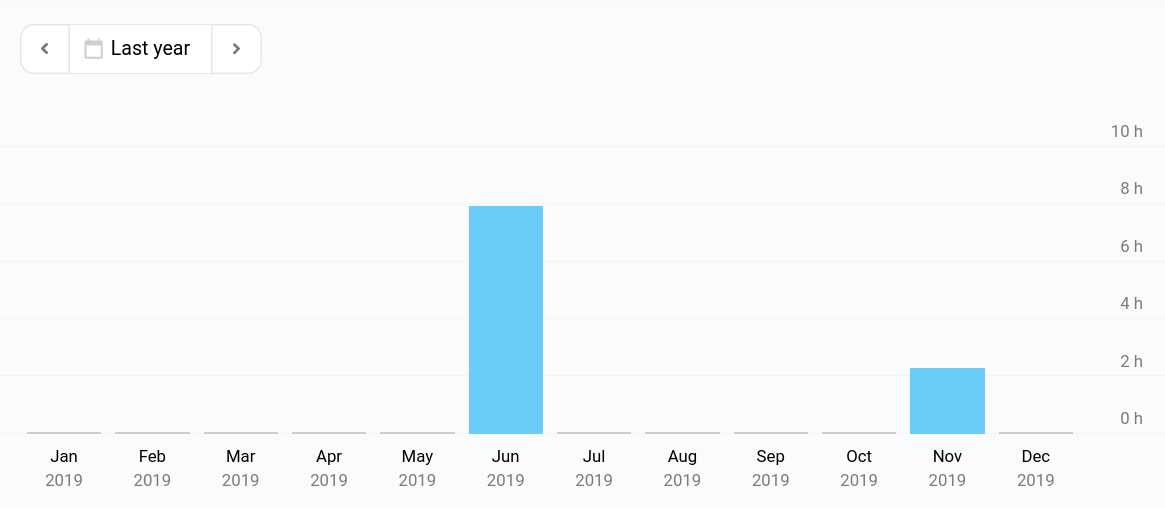
I have a metric for the time I spent doing/planning my talks this year:
June was a busy month, just because I decided it would be. :) I want to keep track of presentations, writing on my blog, etc. because I can easily metric how much I’m donating to the community. Sometimes, instead of working for my freelance, I decided to write and publish something that may be useful to someone else. Sometimes I decide to create slides for my next presentation at a local meetup. If I take the ~10 hours, I can easily measure how much I’m donating to the community by applying my freelancing hour rate. It may be useless for other people, but it’s highly valuable for me.
I don’t want any money in exchange, but it’s important for people to know that others are donating their time because they like to do it and because they believe it may be useful for someone else. I’ve been participating/organizing communities for more than 10 years now and I know how easy it is for people to take local meetups for granted as it is free and someone else is taken care of it.
Moving along with the metrics, let’s check what data rescuetime can provide regarding my productivity. :)
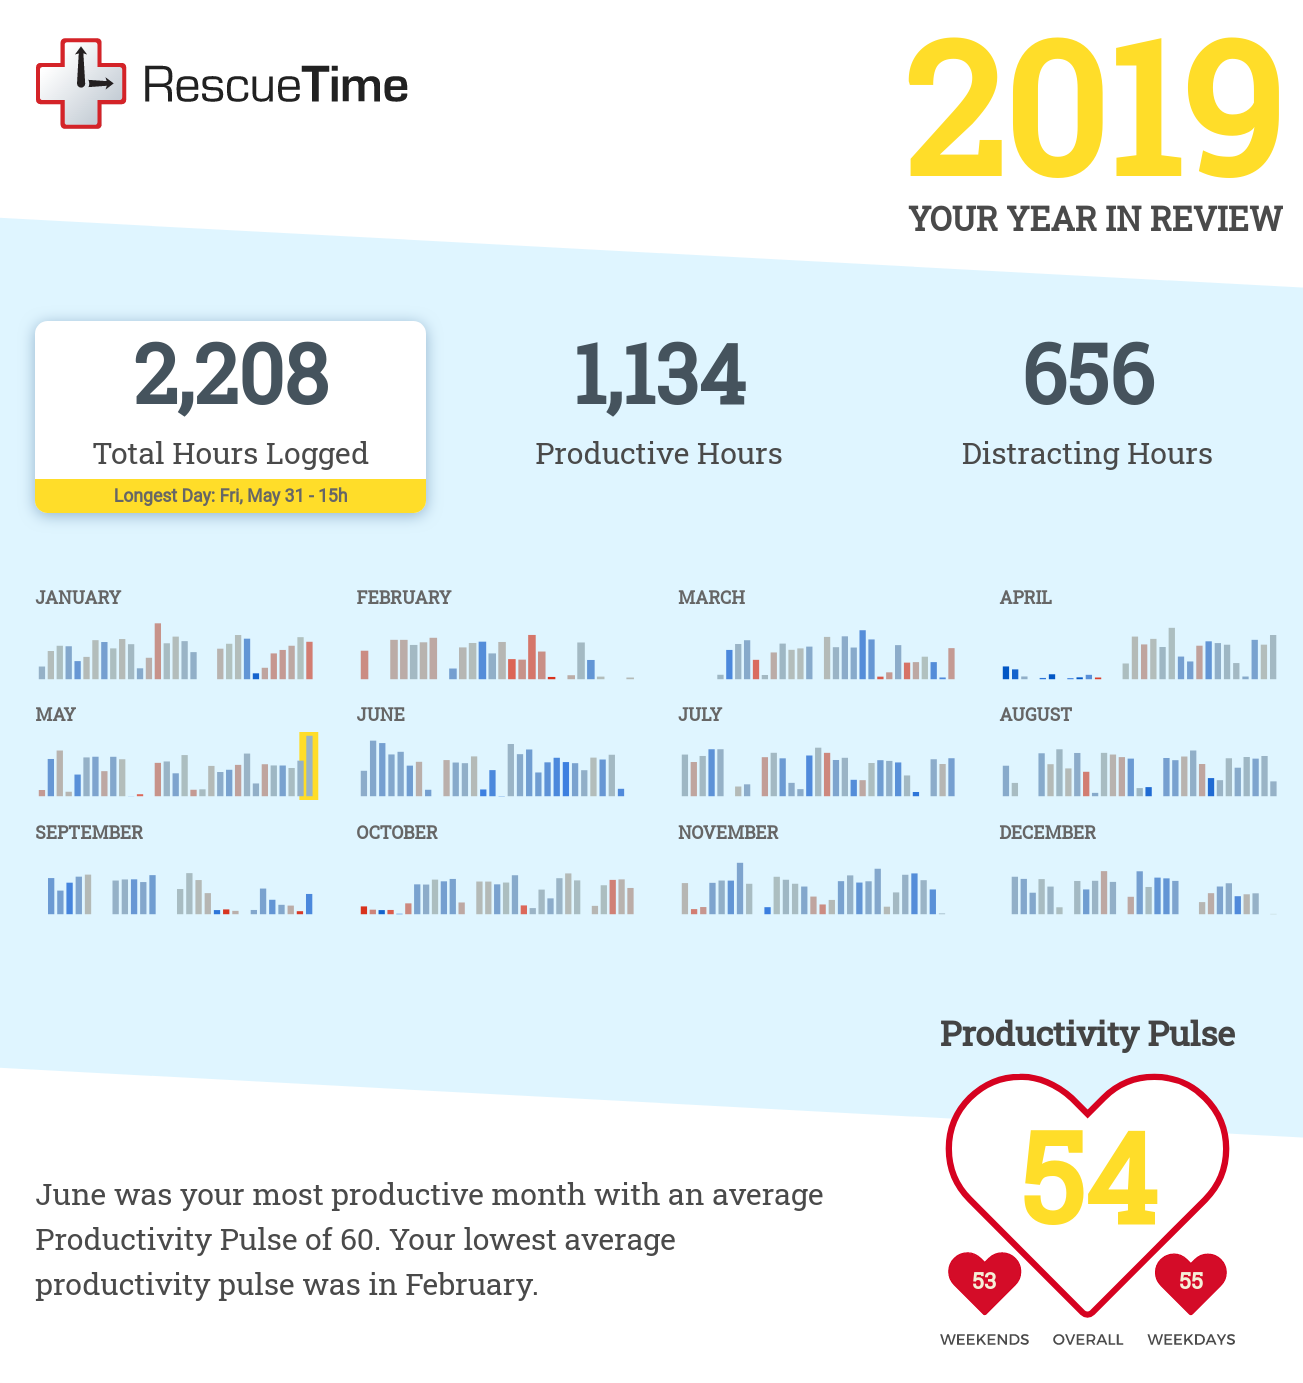
Let’s look at the productive and distracting hours for the entire year:
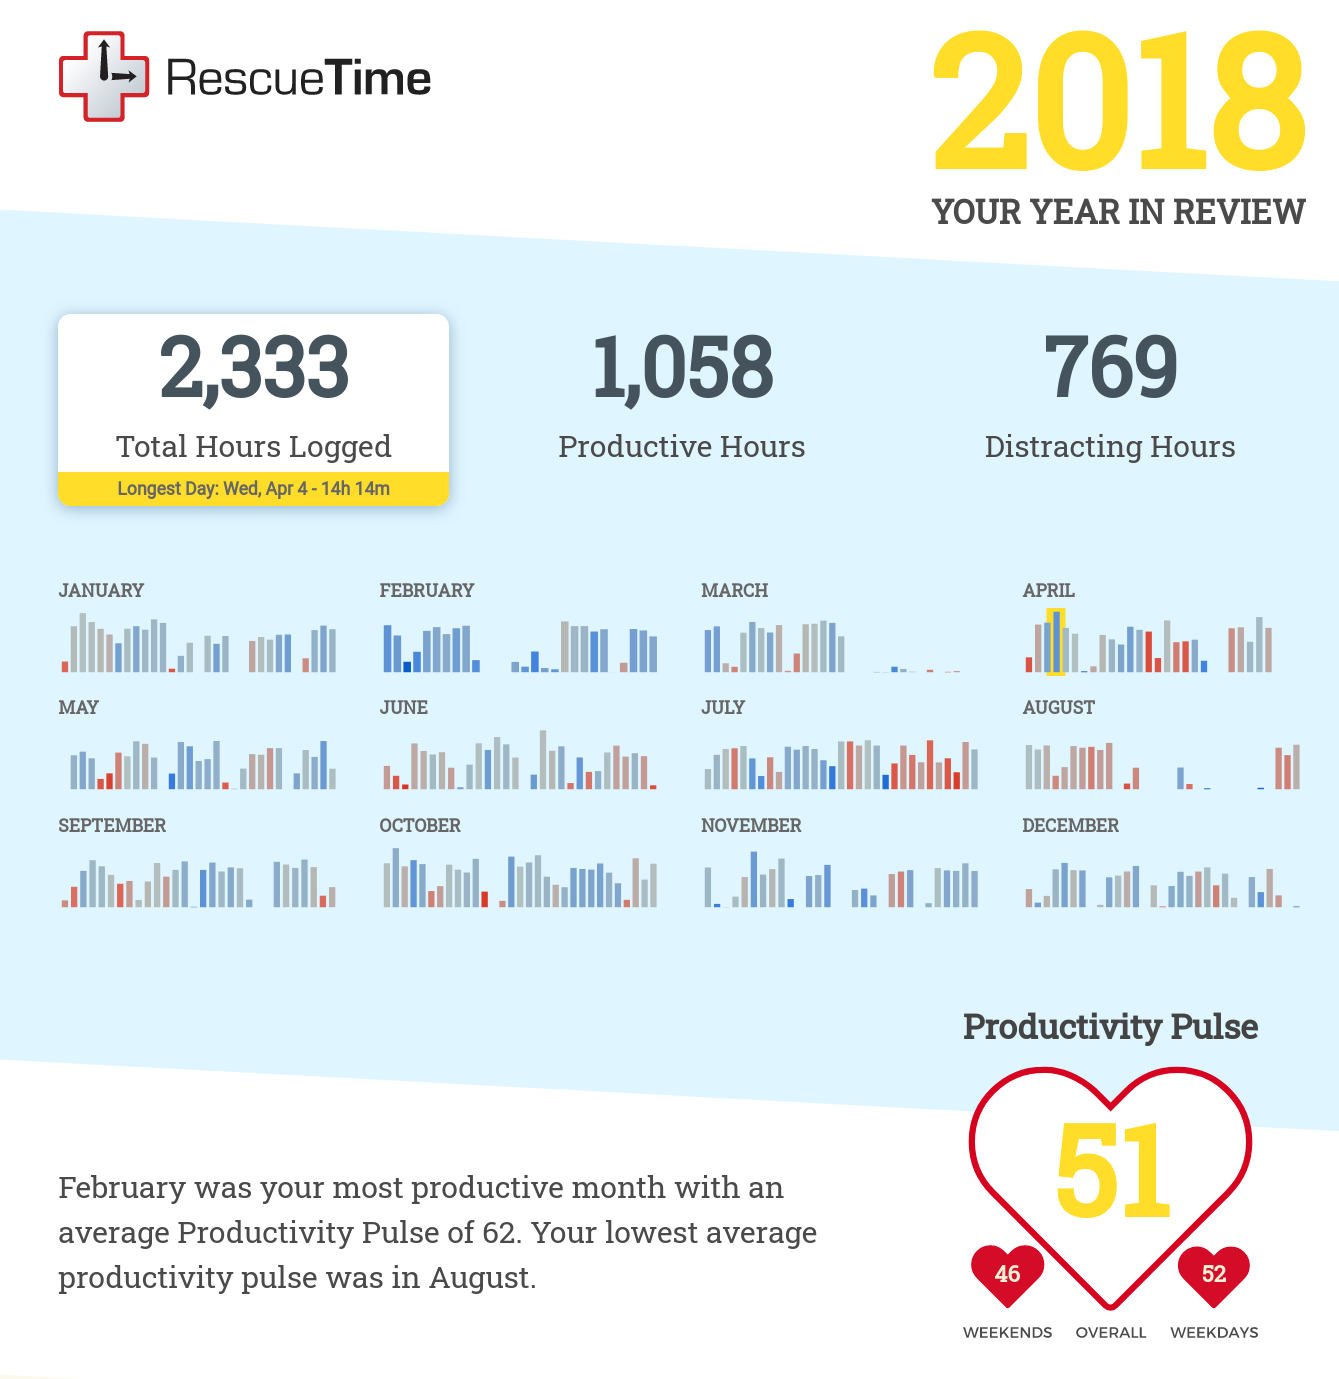
The metrics of 2018 were not posted last here but here are them for comparison:
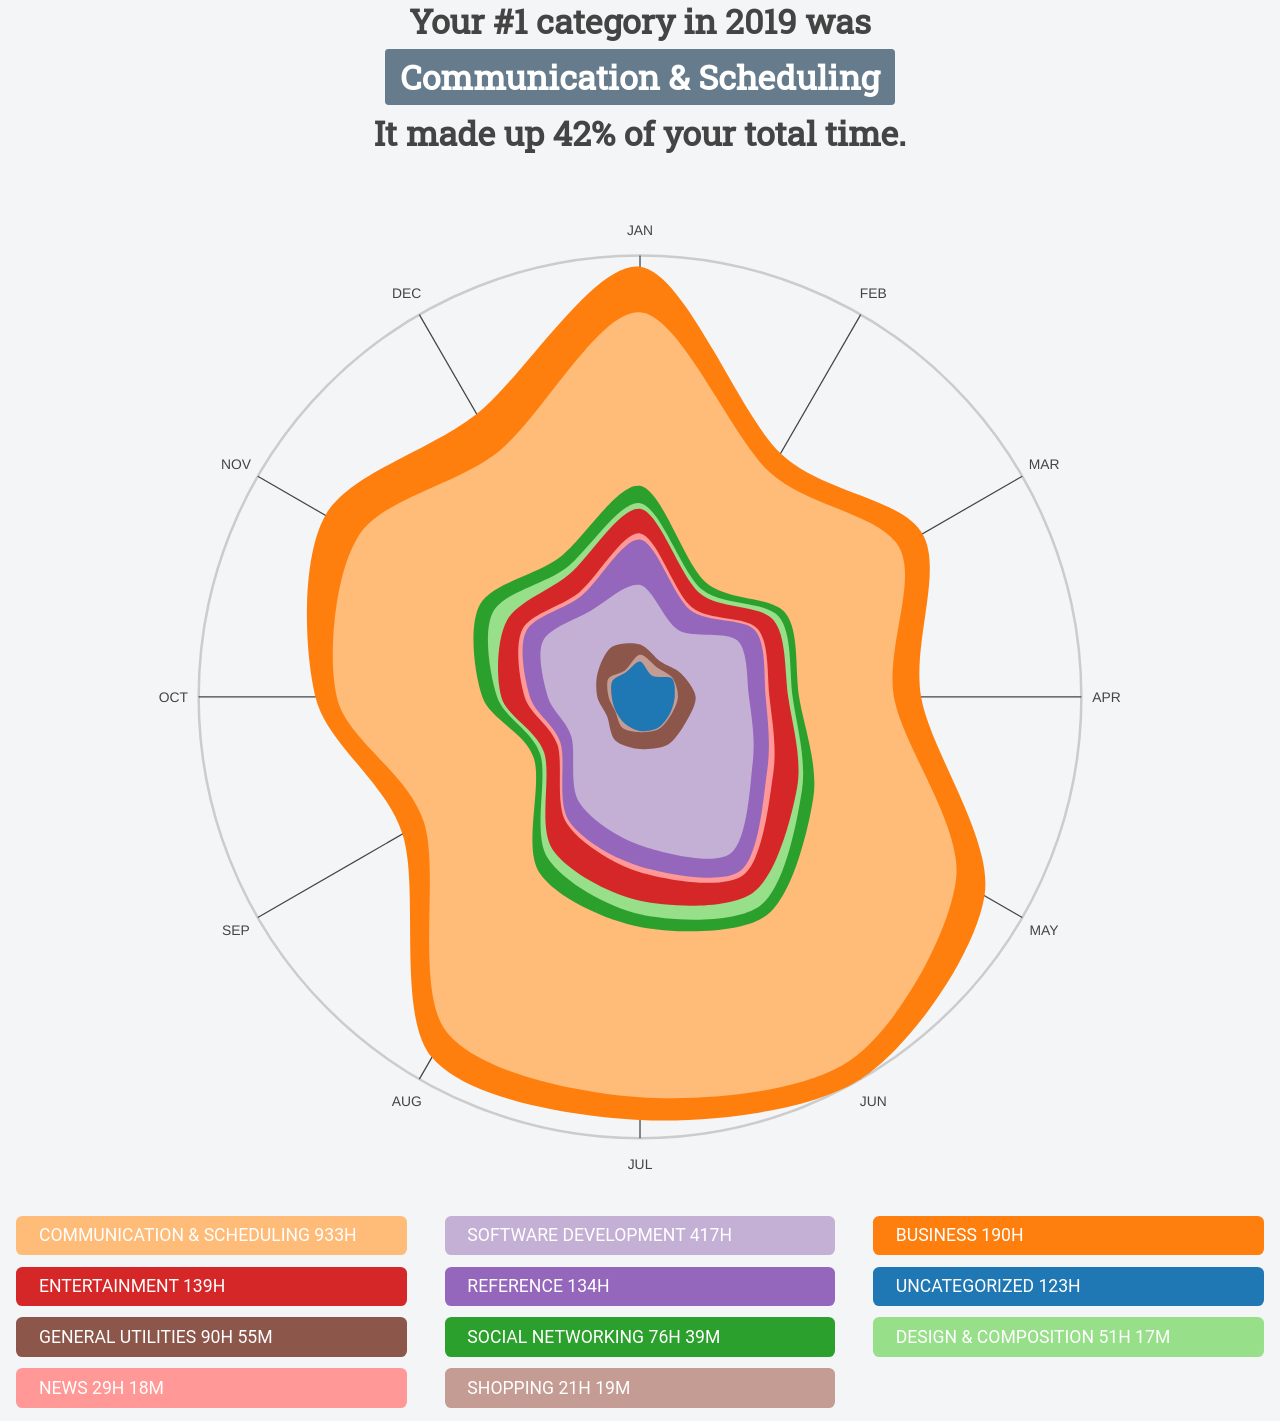
This is part of the year in review provided by rescuetime. They also provide a chart with the categories I used the most:
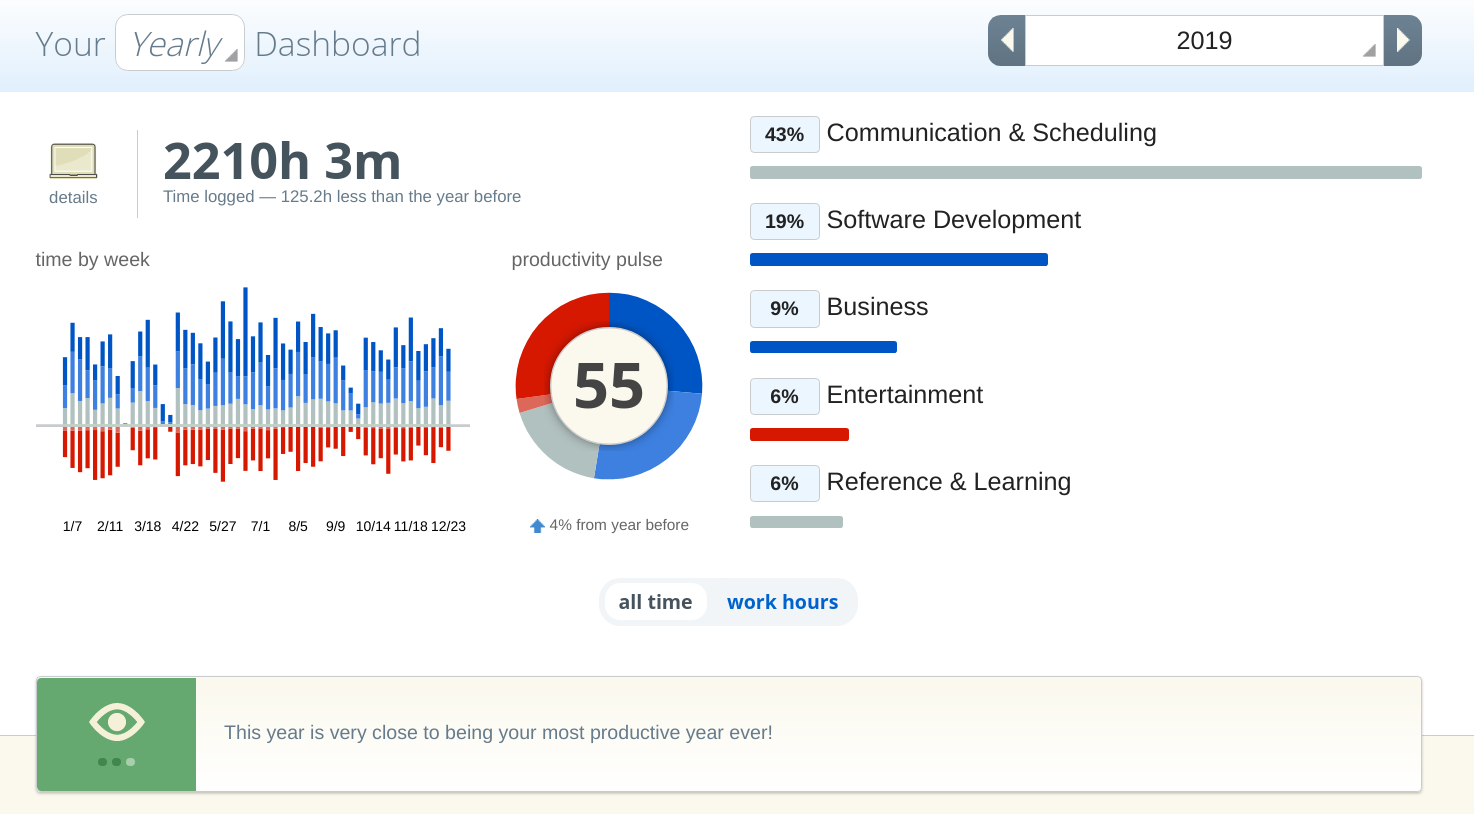
The dashboard shows similar information but with some other things:
I had a lot more productive hours than I had in 2017 or 2018 and this is a good thing. 🙂
Music
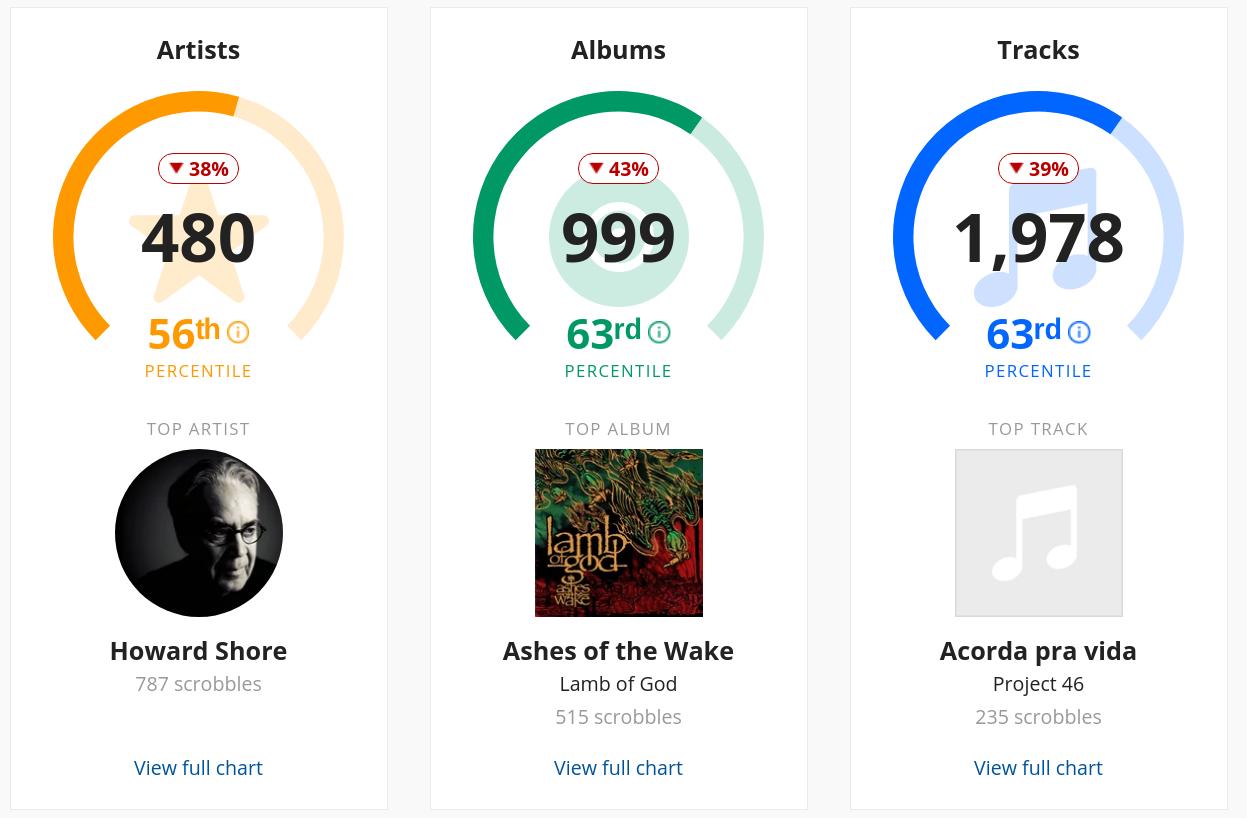
Again, last.fm did a great year in review for me, so let’s check some stats here.
I’m using Google Music for two years now, so I was already expecting to not have 500%+ on my Discovery as I had in 2017. My Discovery this time is mostly related to Pops Staples, which is awesome BTW.
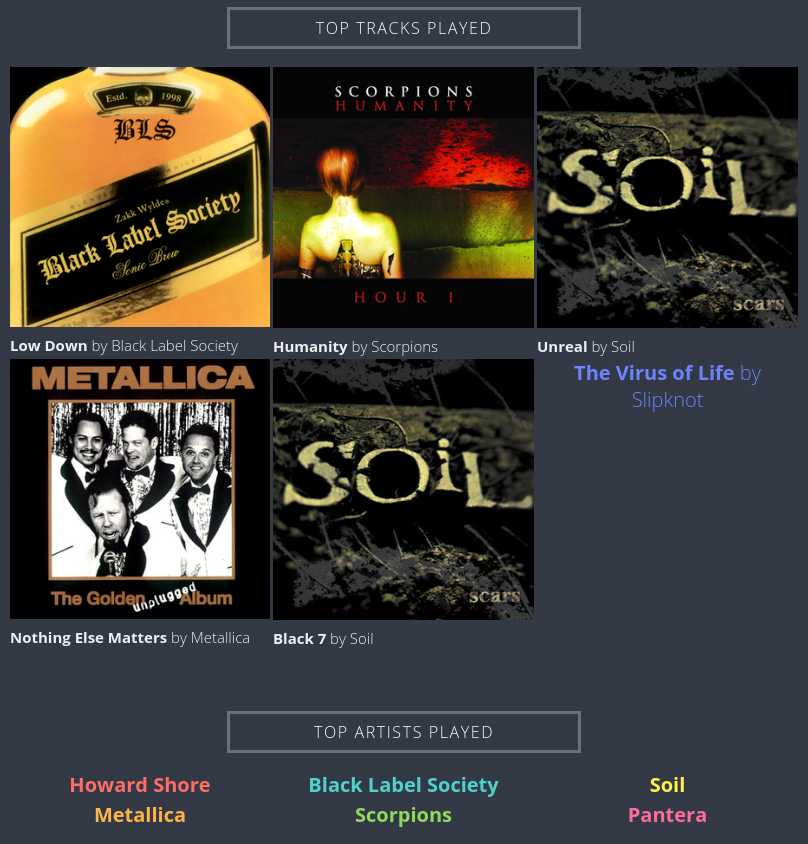
As usual, I’m listening to a lot of Heavy and Thrash metal, along with a lot of Soundtracks, which is mostly Howard Shore (no news here).
In 2017, I listened to more music between 20:00 nad 21:00 and how it changed between 10:00 and 11:00. I believe it’s because I changed, even more, my routine to be even more a morning person. I usually use music to focus or to create the mood for the day, so it would make sense.
I have no idea why Thursday is the big outlier this year. Maybe because I’m afraid about the end of the week and I’m using music to concentrate to deliver everything I postponed on Monday, Tuesday, and Wednesday? LOL
Exist.io also provided data about the songs I listened to (via Last.fm):
This is the piece of information I was missing from Last.fm, so it’s nice to see it here 😃.
TV Shows
I had a topic for TV shows in 2017 and I’m just realizing how this is not a priority for me anymore. I’m not tracking the TV shows I watch and I’m not even watching that much anymore.
There are some TV shows that I watched and enjoyed though: Game of Thrones (it’s not about the end, but the journey) and Vikings. Westworld Season 2 was OK. There’s also Altered Carbon I watched in 2018 that I enjoyed, the concept is great.
To be honest, I don’t even remember the ones I watched. I tried to use Trakt.tv but they don’t provide your data if you’re not paying, so… whatever. I checked TV time and it seems they are adding movies to the app, so maybe I will start using it again since the app is great.
Physical data
In 2017 I had a hard time to come up with the metrics for my Physical activities and it seems things did not improve in the past two years. Someone may say I should buy the expensive band X or the super expensive hardware Y, but please don’t. I prefer a simple and inexpensive device that tracks and sends the data to other places.
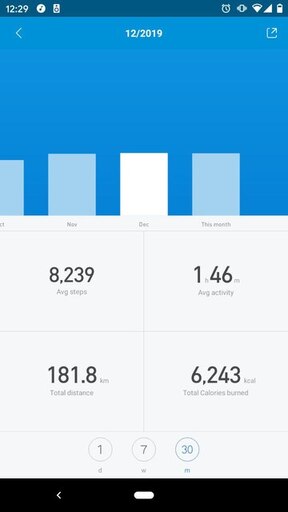
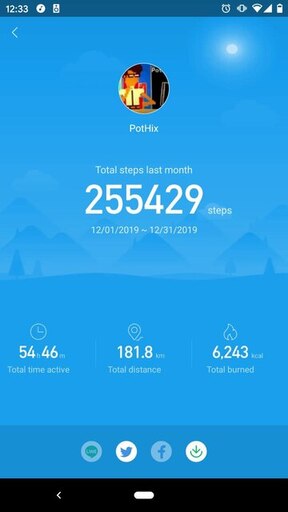
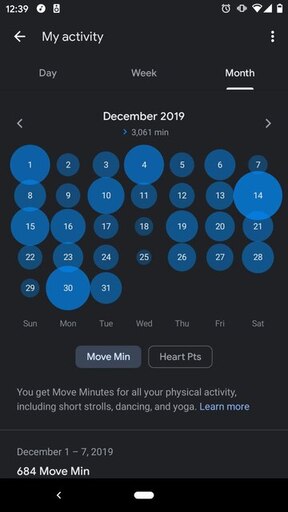
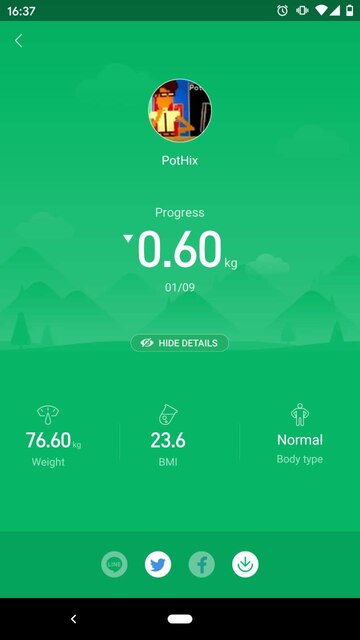
Getting back to what I have. Now I can’t get that many bars on screen no Miband and they only provide a monthly summary, not an early one. Google fit is not very helpful as well:
My savior this time will be Exist.io, because they have monthly averages:
It’s just an average, not the full number of steps, but it’s good enough. I don’t need the total number of steps by year, as my goal is just to understand if I’m walking enough, and I don’t need a precise number for that.
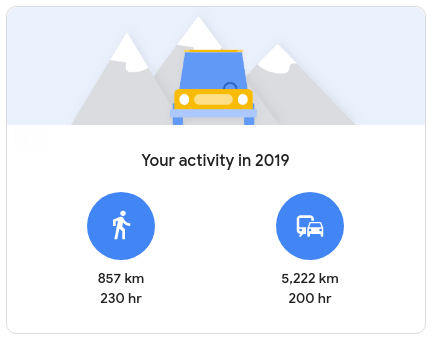
Google location timeline gave me some yearly numbers about walking and public transportation:
It’s nice to see I walked more than 800km this year. April was the month I had more steps and it was probably because of my vacations in Portugal 🇵🇹.
Weight
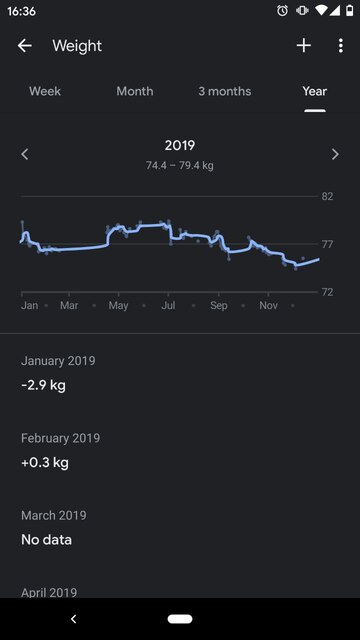
I tracked my weight this year as well, here is the data I have:
Some data is missing from January to May, but after that, I took the Gym and diet seriously, so we can clearly see how things start to improve.
When I got back from vacation (October), I was ready for some improvement again and I lose more weight. The weight doesn’t mean much as there are many other important things to track. In my case, I know it was not just weight, I have better muscles than last year and feel much better as well.
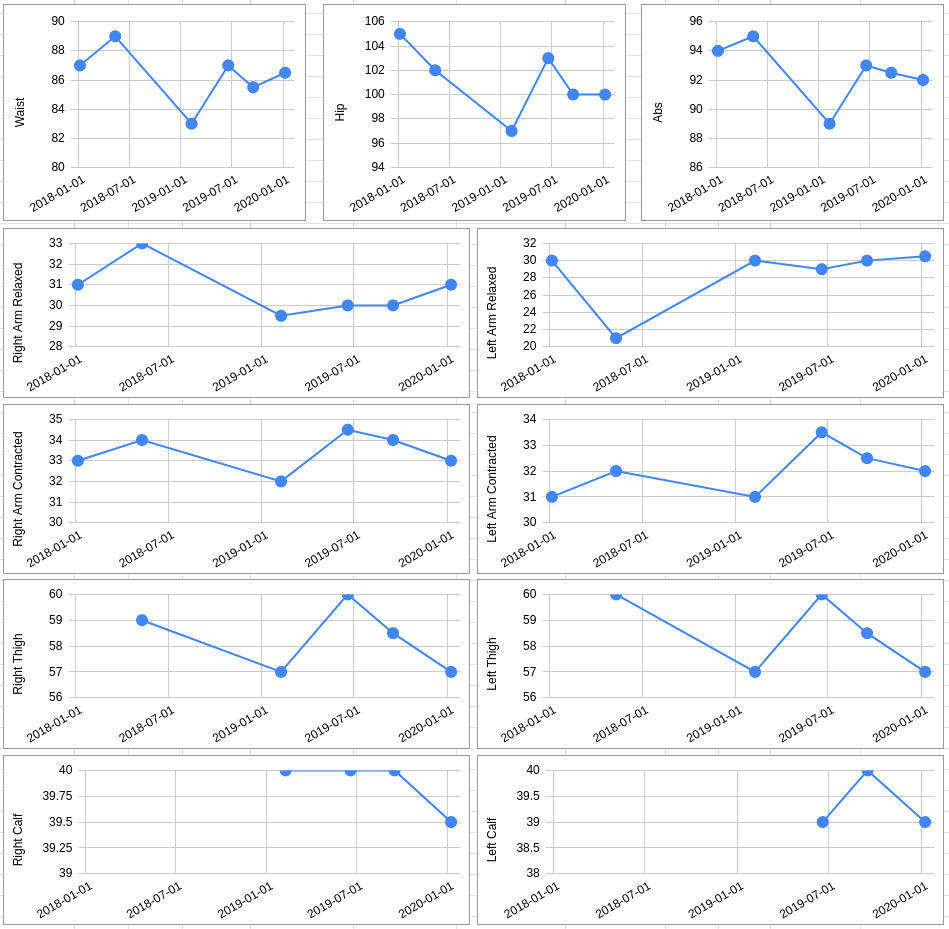
I don’t have that many metrics from the Gym. To be honest, I don’t like Gyms that much, so I try to do only do the really necessary things. I do measurements from time to time because it’s provided by the Gym. I do everything on paper there, so I don’t spend any time with that.
I take pictures of the data and keep it with me. This time I decided to just quickly put that on a spreadsheet and generate some charts. Here is what I have since 2018:
As you can see, there’s not much data and data is missing sometimes for some reason. All measurements are done in centimeters (of course). For the three initial charts, the less the better. The opposite is true for the charts below it.
There’s not much to correlate between the Gym measurements and the weight though.
Sleep
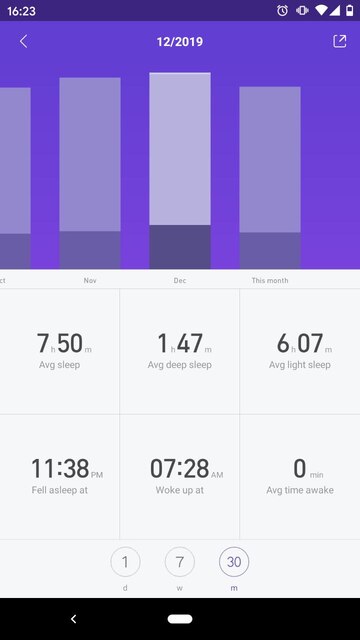
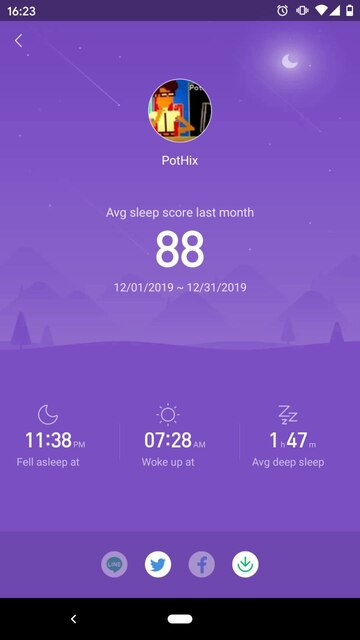
Again, the Miband app is not very useful:
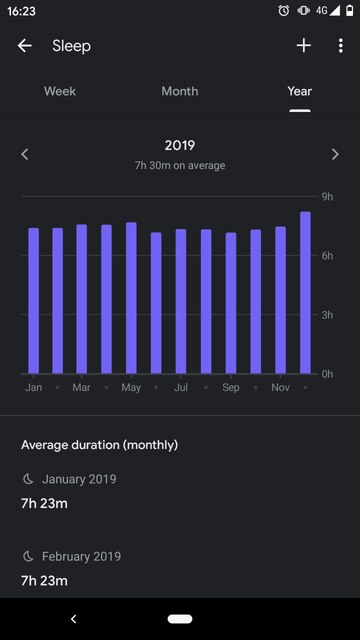
I sync the same data with Google fit and connect it to Exist.io. Those two services provide some good visualizations of my data:
I finished reading Why We Sleep in July and I was curious to see how changing my routine influenced my sleep. I was expecting to have a more immediate impact on August or September, but I can see I only had a real impact after September. :)
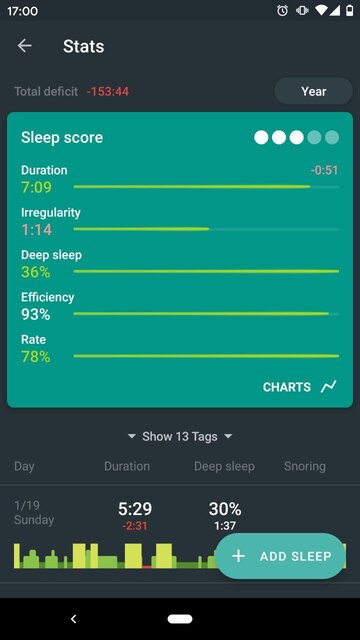
I’m also using the Sleep as Android app to get some sleep data. I connect it to my Miband and let it track. Here is the data I was able to extract from the app:
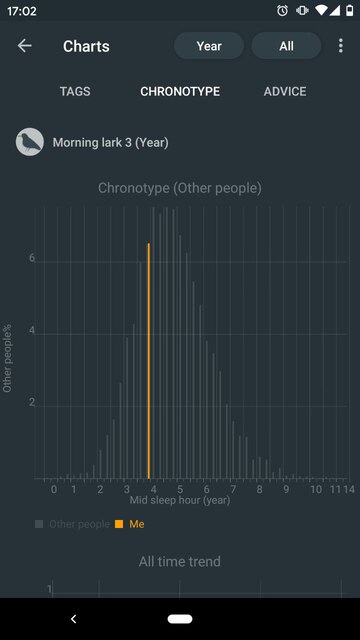
I’m a morning lark. I usually work better in the morning and go to sleep earlier. The average duration of my sleep is a bit low in this app for some reason, but it’s usually between 7h and 7h30m.
The Efficiency is the time I’m in bed but actually sleeping not browsing the internet or having problems to sleep. 93% is a good value.
My deep sleep is decreasing in the past months for some reason, I have to improve this situation. I believe the decrease of deep work is happening because of my habit of looking at my cellphone before sleeping. I will try to cut the cellphone at night again.
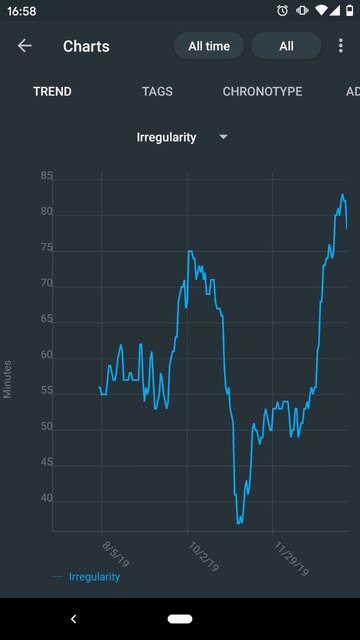
My irregularity of sleep is also not good, I should have close to no irregularity of sleep. I hope to improve that until the middle of the year, after that I can’t promise anything. 😉
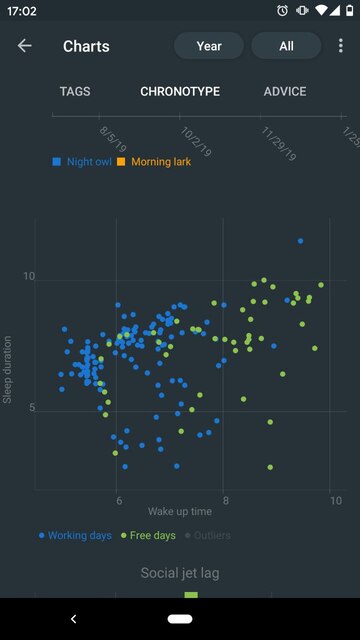
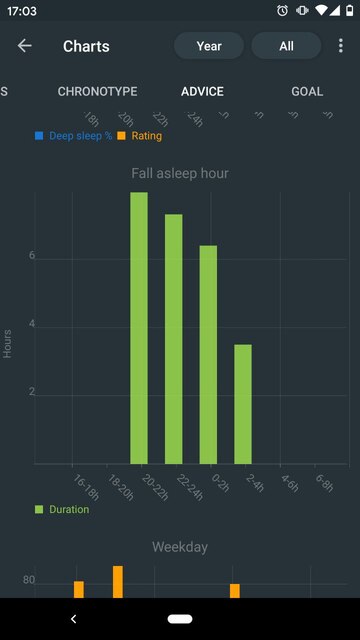
It’s interesting to see that I usually wake up later and sometimes sleep more when it’s “free days” (holidays and weekend), but most of the time I keep the same duration. The time I go to sleep is also clearly related to the duration of the second chart. I believe this is pretty common since I have time to wake up but not a time to go to sleep. I’m aware of the problem already and I hope to improve it.
I’m happy with the sleep data I have and I have to say I’m curious about the data I will have about that next year.
Words written and errors
This year I didn’t have the data to consolidate and I don’t want to check every weekly email to consolidate it. Grammarly will have to do better if they want their customers to get better data about their writings. Sorry Grammarly, weekly emails are not enough.
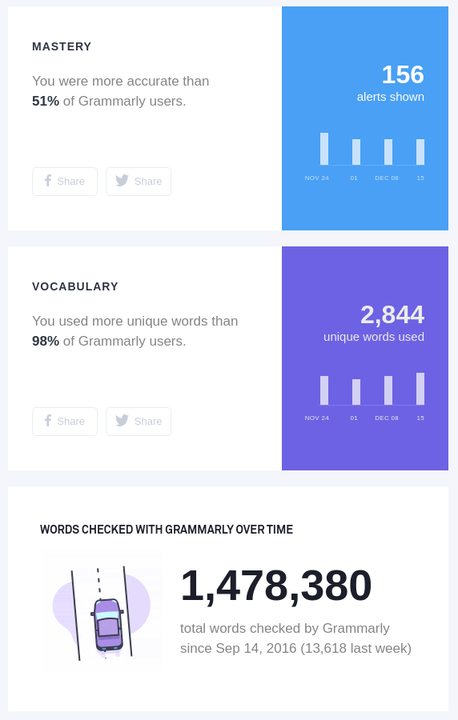
This is the data I have from the last email I received before my vacations in December:
We can see that I wrote almost 1.5MM words since I started. I checked the first time Grammarly sent this number and it was 963,838 words written on Feb 11th. Let’s do a simple math:
1478380 - 963838 = 514542   -- words written between Feb and Dec
514542 / 10 = 51424 -- words by month (Feb -> Dec)
It seems I write around 50k words every month. It would be around 600k works a year. 🙂
I would love to have a chart like the one I had in 2017 so I could see what errors I had and so on but it’s not viable, unfortunately. 😕
Locations
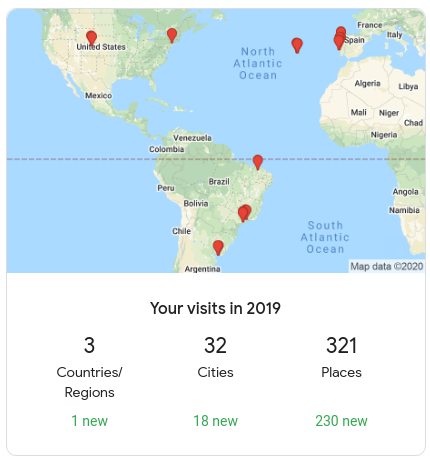
In 2018, I went to Chile and the USA. In 2019, I went to Uruguay, the USA, and Portugal.
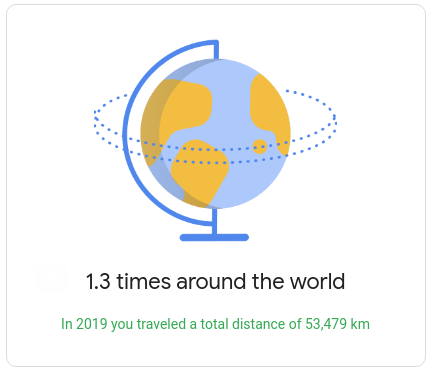
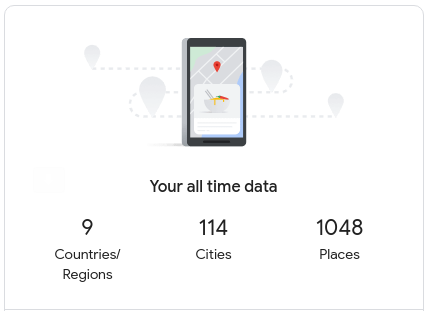
Here is the summary of the year and all-time data by Google:
I have to say that I’m very proud of myself when I see all-time data. I believe that getting to know other places and cultures is something that expands your mind in many ways. 🙂
Here are some of the cities and places I visited this year:
I’m quite satisfied with my trips in 2019.
Expenses
I have some sad news about my expenses data this year. The app I was using before is now even worse, so I decided to not use it anymore and remove all my data from there.
The good news is that I decided to invest more time on investing this year, so I had to organize my finances somehow. Because of the need for an organization, I had to get all my investing data into one spreadsheet.
I decided to use dlombello’s spreadsheet for that (pt-BR only). I have to say that I’m amazed by how feature-complete is this spreadsheet. It’s still worrisome that you have to give full access to your Google account for it to work (because of external scripts), so I created a Google account just for that. Until now, it totally worth the effort.
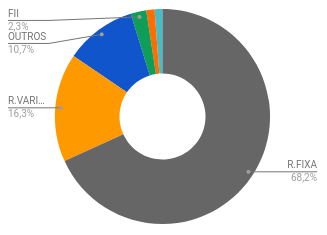
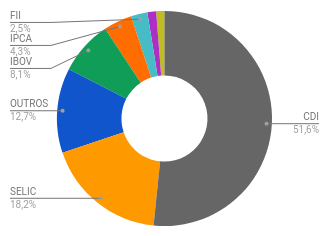
Here are some charts I can get from the spreadsheet:
The first chart shows the types of investments I have. The Orange and green are related to the stock market and the rest is bonds and others. The second chart is the indexes these investments are related to.
I don’t think these charts are very good, but I started to use this spreadsheet last month and I don’t have that many ways to retrieve good information from it yet. I hope to have better data next year, let’s see how it goes. 😉
Regarding my savings, it increased by 23.87% this year (compared to 26.72% in 2018 and 16.83% for a bit more than half of 2017), an average increase of 2.57% per month.
In 2017, I said I had 75.10% of my savings goal. Well, I met this goal in 2018. 😅
The plan was done long ago and it doesn’t make sense anymore given the current economic conditions. I decided to keep it anyway as it would be good to keep the history until I meet the goal. When I finally got to the value I wanted, I started a new plan.
Considering this new plan and the whole year of 2019, I have 89.40% of my goal. I know it’s weird to just introduce this value without further background, but just wanted to keep it here for my future self.
Given the current circumstances and my life choices, this goal will have to change this year. I’m OK with these changes, it’s important to have plans but it’s also important to change them if the circumstances require such change IMO.
I’m looking forward to seeing what this new year will do to my expenses and general portfolio 😅.
Time to write this blog post
Phew… finally finished this one. 😅
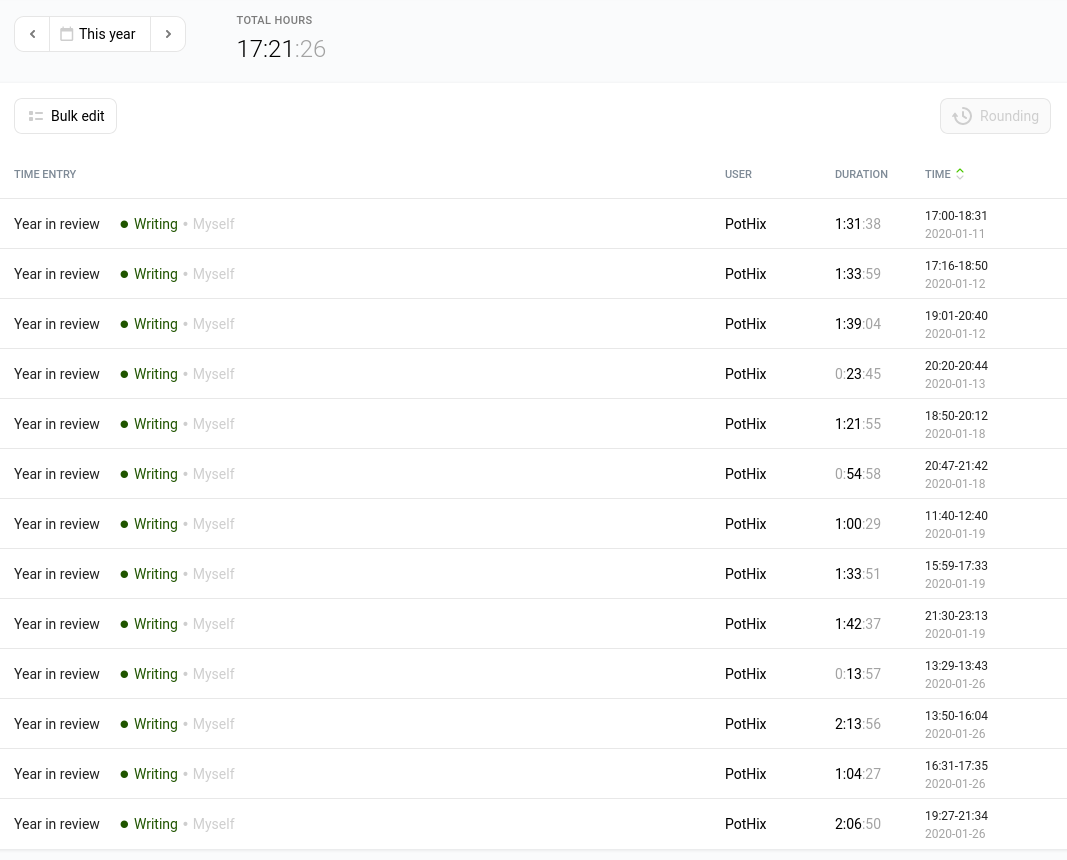
This time I could track the whole process and it took 17h21min to write this blog post.
I can say the same thing I said in 2017: It totally worth my time to write this. We have so many good insights when reviewing the data we collected. 😌
Conclusion
I have nothing to complain about 2018 and 2019. The only thing I should have done earlier in the year in review for 2018 because it totally changes my mood about what I did. It’s great to do reviews because you can clearly see (at least it’s the case for me) that you did what you wanted to do in the general context.
It’s clear to me that doing my year in review in 2017 helped to improve things I could only see when looking in “bird’s eye view”. Some things are not so noticeable when you’re seeing them in context, but they become clear when you put them in a yearly context.
I’m sure 2020 will be a year full of huge challenges for me, but I’m also curious to see the data I’m going to collect this year! 😉

