7 minutes reading | Também disponível em 🇧🇷
Stats for sep, 2017
It’s already the end of October and I could not manage to post my stats from September but I have a good reason for that (which you will read about in the next month 😉).
Books
What Doesn’t Kill Us: How Freezing Water, Extreme Altitude and Environmental Conditioning Will Renew Our Lost Evolutionary Strength is a book that describes what the human body can do if trained for it. The writing process is not so good for my taste, sometimes it looks like a memoir, sometimes it’s non-fiction… but the message it passes is really interesting. The evolution did a lot of work for us but we’re kind of using technology to do some stuff for us and losing part of what we developed. I recommend it, BTW.
It was really less books read then last month, but it’s ok. I had a lot of pressing things to do this month.
Articles
As usual, I’m using that same export file from Pocket and the same script to calculate the amount of articles I read:
var uls=document.body.getElementsByTagName("ul");
for(var i=0; i<uls.length; i++) {
    console.log(uls[i].children.length)
}
1214
898
It means I have 1214 articles Unread and 898 articles Read. Comparing with my results from the last month (1157 unread and 883 read), I got around 5% more unread articles and 2% more read articles.
I did not take so much time for articles reading this month, so the numbers increased less than they use to. It was also affected by the time it took to generate the numbers last month.
Another correlation with this one may be related to the fact that I’m only reading my Feedly once a week instead of every day, that helps a lot to not add many articles to Pocket. :)
Coding
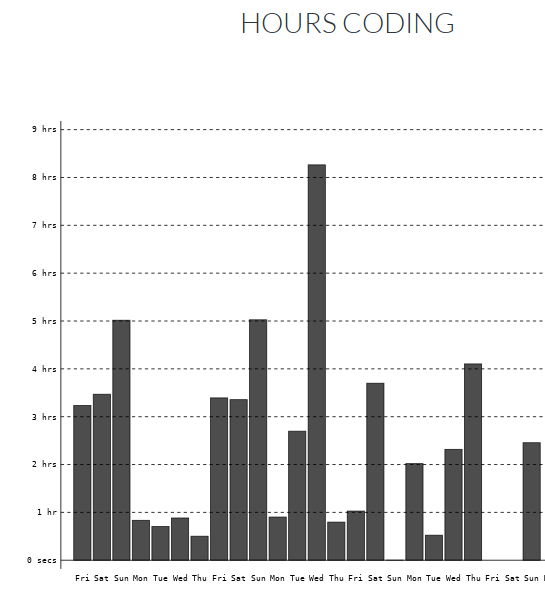
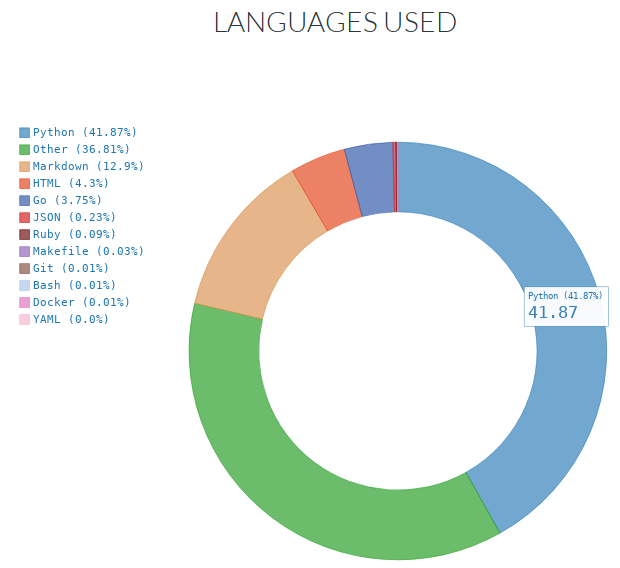
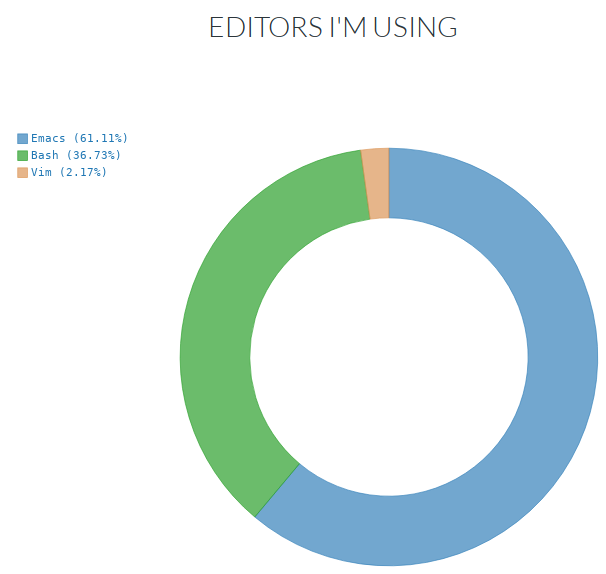
Here goes the charts from Wakatime since the last post.
As usual, it’s kind of the average with one outlier. This average of 3-4 hours coding always bugs me.
I don’t know why markdown always takes the lead (after bash), but Python is coming as it should.
Nothing new to editors. I still use Vim, but Emacs is the leader by far.
Speaking
- Fazendo um snake game com Python 3 e PyGame para se divertir at GruPy-SP
- Lightning talk: Brincando com API’s e jq at Guru-SP
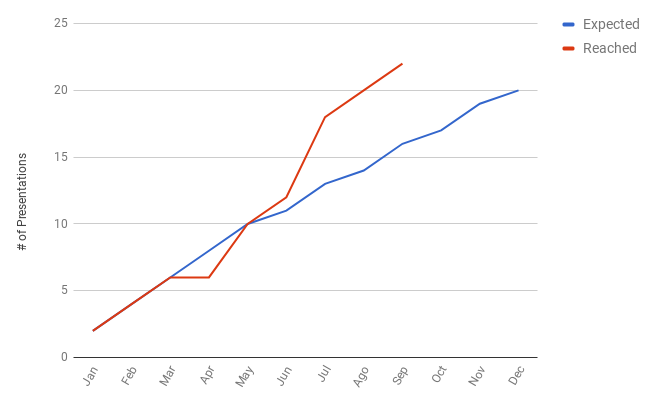
This was an ordinary month regarding presentations, but still following what I had defined for my goal:
The goal was reached this month! I will try to keep the same rhythm and maybe speak in different countries in October. :)
Completed tasks
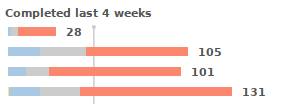
This is the amount of tasks completed on Todoist.
365 tasks completed this month (169 less than last month 😞).
Podcasts
Here is my Podcast Addict stats:
1 day and 16 hours of podcast time, almost 1 day more than last month. As I said in the previous month, when I listen to less audiobooks I usually have more time spent on podcasts. 😄
I decided to keep a list of the Podcasts and their times as well.
Just remember that this is an “all time list” and I’m tracking time instead of episode which makes short podcasts to not appear as “most listened” ones. I listen to CBN podcasts almost every day, but they are just some minutes long.
Hours working
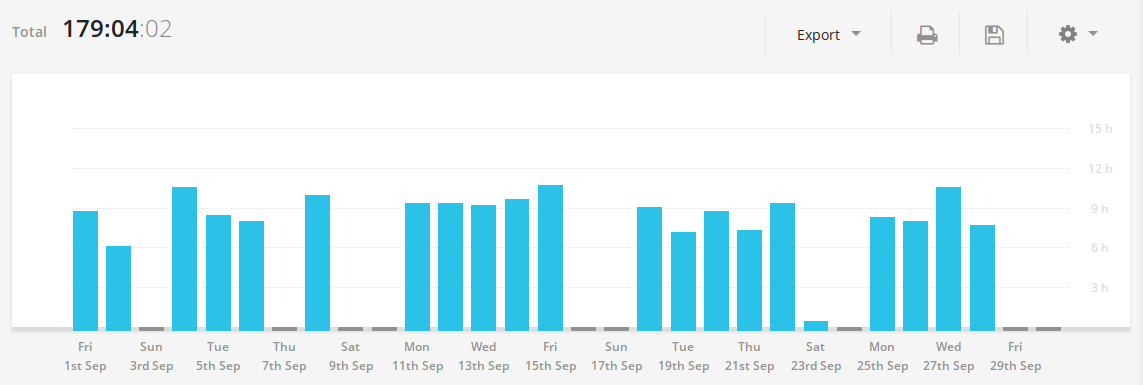
Here is the data from my time tracking software, Toggl:
The above chart is just for my freelance and full-time job. Currently it’s just my full-time job, because there are some stuff preventing me to work on my freelance.
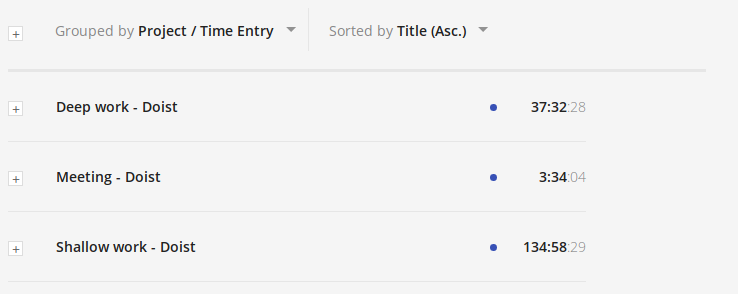
Here is the difference between shallow and deep work regarding my full-time job:
It was less deep work than last month (10 hours less) but it’s good to know I’m still spending around 1/3 of my time in Deep Work state. I’m also tracking time in meetings and it was half of the time spend last month. 😁
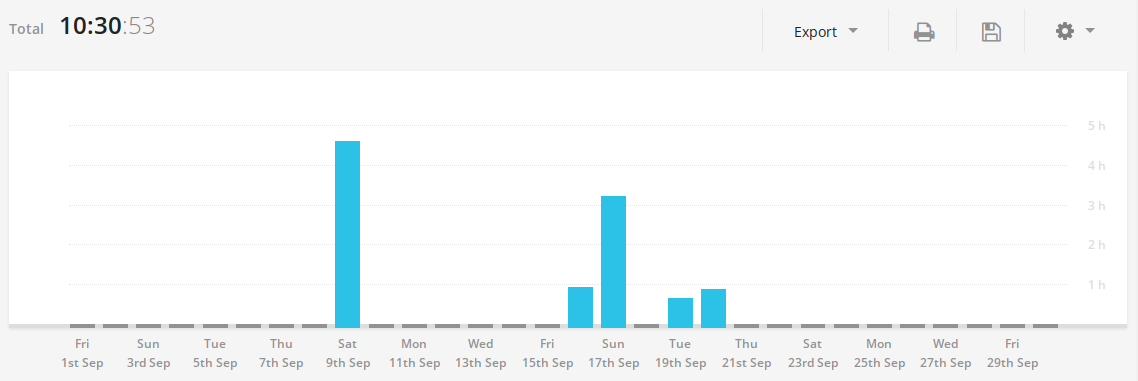
There is another chart for my personal projects:
A little bit more personal projects but they are all related to my presentations. :)
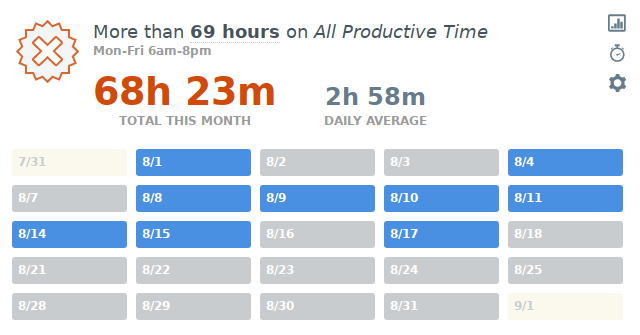
Here is my data from RescueTime:
Unfortunately I had a problem with Rescue time this month (and probably next month too, we’re debugging it) and my data is not being collected properly. 😢
But there is not just bad news for this case! I now have a partnership with rescuetime and have access to a premium account. Thanks rescuetime team! 😁
Physical activity
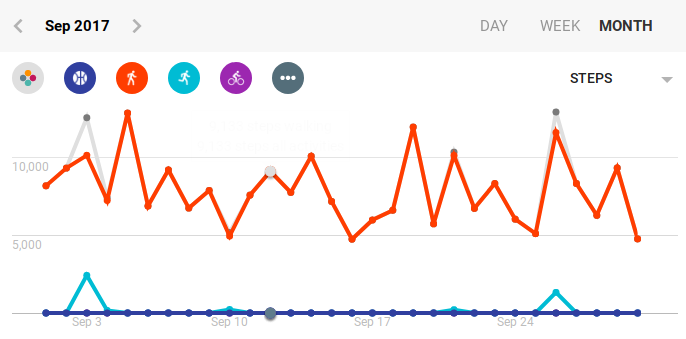
I’m using my Mi band data to calculate my average steps:
According to this data, I can conclude that I had a daily average of 8.6k steps (258/30). It was almost 50k more steps than last month, which is really good.
And these are my steps each day:
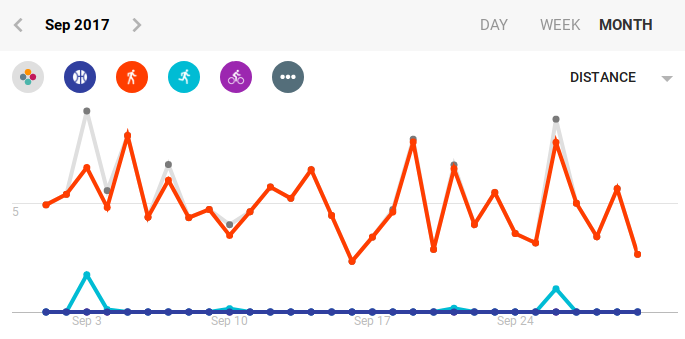
My max distance was 9.2km:
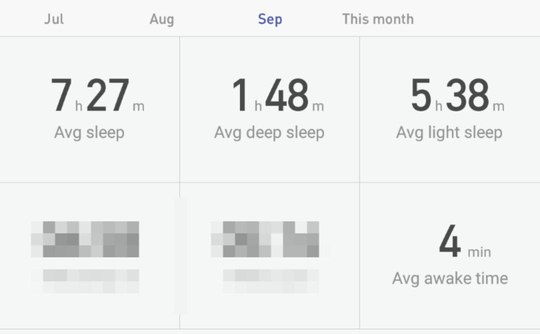
Here is my sleep data for this month:
Less average sleeping (7h49m for the last month) and also less deep sleeping for this month (last month was 1h48).
TV Shows
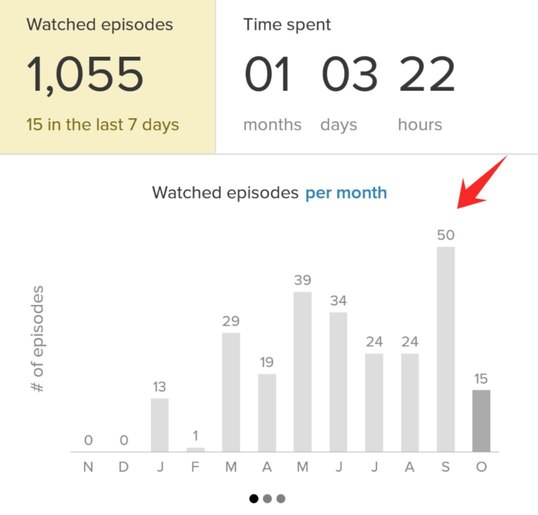
According to tvshowtime I watched 50 episodes this month! It’s a personal record but I’m not sure if this is good or bad.
It’s a combination of The defenders, Marvel agents of shield (season 4) and Orphan Black (seasons 1-3).
Unfortunately I got the results too late and I can’t calculate how many hours I spent watching TV this month. 😢
Words written and errors
I’m using Grammarly to improve my English and track the amount of words and errors when I’m writting. Unfortunately, they only send weekly emails, but I will try to keep this metric for a while.
My stats for this month:
- 73969 words written (69493 last month)
- 1826 corrections made (1881 last month)
- 17139 unique words (13925 last month)
The numbers keep rising because all of my work conversations are in English and that’s nice. I had more than 6% more words written , around 19% more unique words and 3% less corrections made (!!).
It was great to see less corrections made this month, it seems I’m improving! 😄
Locations
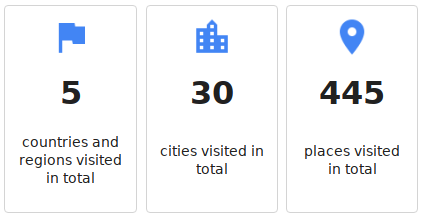
For some reason, there is 1 city less than next month. I really don’t know how Google calculates that. 😞 But visited 11 places this month.
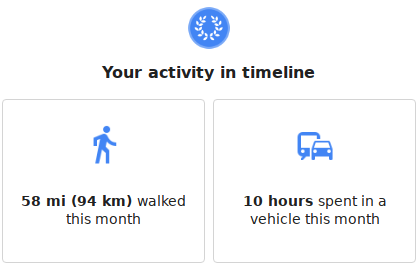
Here is the time spend in vehicles:
Just 10 hours spent in transport, that’s great. :)
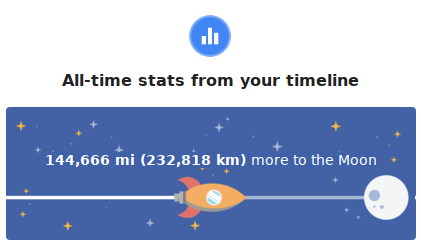
Hope to reach the moon some day.
Expenses
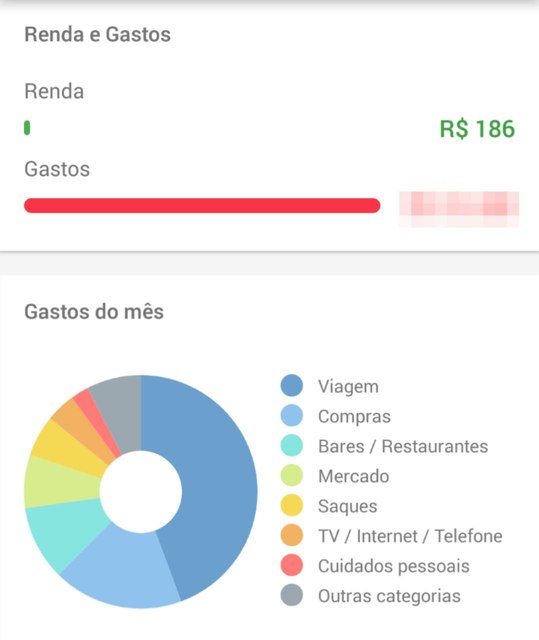
My expenses for this month:
This chart represents all my income for this month. The number is not wrong, I did not receive any money this month. The problem I described in the last three months still persists, for this reason, there’s no money coming yet. :(
So… the situation is the same… My wife is paying all of our bills until my situation gets back to normal. I’m stressed with this situation but it’s great to have someone to rely on when things like these happen. ❤️
Unfortunately I did not checked all my finances in the beginning of the month, so I can’t tell how it was. I will keep the same value as the last month, so I still reached 74.23% of my goal.
Time to write this blog post
Some people are asking me about how much time it take to collect all the data and write the blog post, so I decided to add this metric.
It took 3 hours and 16 minutes to write this post
I wrote part of it during an airplane travel so its approximate.
Conclusion
Again… excluding the fact of not being able to receive my payment because of bureaucracy that has nothing to do with what I do, this month was good. I had to rush to get everything setup for my travel in the next month but it was cool.
I’m already aware that the next month will be really different because I will take 1 week off and will work from different locations. Let’s see how it goes.

