8 minutes reading | Também disponível em 🇧🇷
Stats for Jan, 2018
I’m excited to write this post about my performance for the first month of the year. I think I will have some great news at the end of this post, related to my expenses.
Let’s get started! 😀
Books
I decided to listen to my podcasts this month, so I did not hear that many audiobooks. The only book I read this month was a physical book:
Hiding in unnatural happiness is a book I received from a monk in York. It was the first time I heard about Krishna, Bhagavad Gita, and some other things. It was an exciting read, but 3 stars are enough for it.
Articles
As usual, I’m using that same export file from Pocket and this time I changed the script to calculate, it will save me some time in the next month:
var pocket = {unread: 1296, unread_pct: 1.00, read: 946, read_pct: 1.00};
var uls=document.body.getElementsByTagName("ul");
unread = uls[0].children.length;
pocket["unread_pct"] = +((1 - pocket["unread"] / unread) * 100).toFixed(2);
pocket["unread"] = unread;
read = uls[1].children.length;
pocket["read_pct"] = +((1 - pocket["read"] / read) * 100).toFixed(2);
pocket["read"] = uls[1].children.length;
console.log("var pocket = " + JSON.stringify(pocket))

var pocket = {"unread":1352,"unread_pct":4.14,"read":1008,"read_pct":6.15}
It means I have 1352 articles unread and 1008 articles read. Comparing with my results from the last month (1296 unread and 946 read), I got around 4% more unread articles and 6% more read articles.
A significant increase this month but it’s great to see the books read percentage higher than the read one.
Coding
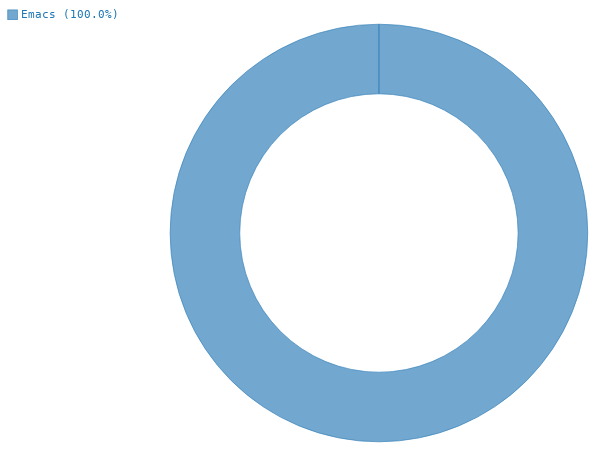
Here are the charts from Wakatime since the last post. I will start with editors this time:
It looks like my Vim configuration is not working, just fixed that but my metrics were not collected. 😞
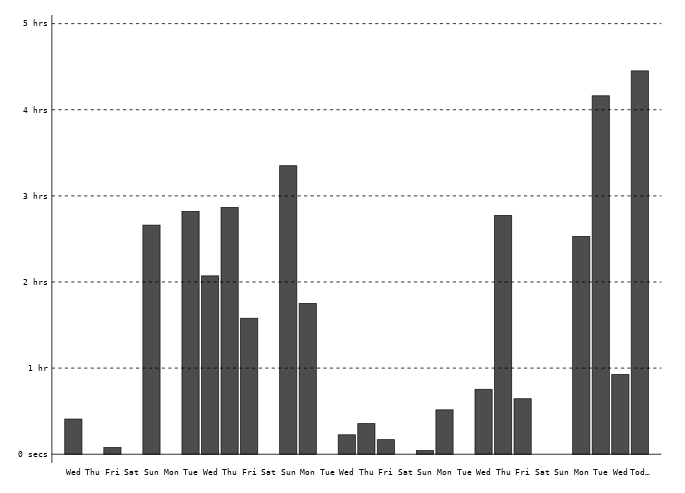
It doesn’t look correct, unfortunately. Some hours are missing here. 😞
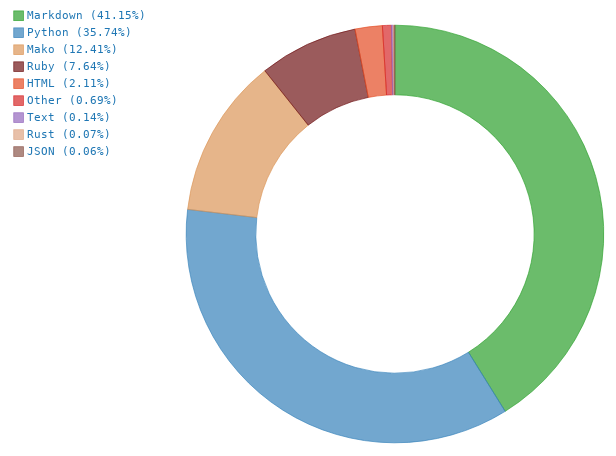
As usual, markdown and Python are present. I tried some Rust as
well and did some Ruby coding because of my presentation and some
freelance coding.
Speaking
No presentations were done this month. I will not post a chart for that anymore. I don’t have a goal related to it this year.
I submitted talks for two conferences, maybe I will have some good news next month. 👀
Completed tasks
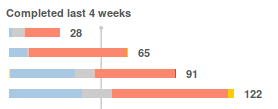
Here is the comparison of the tasks for the last month (first) and the tasks for this month (second). It was extracted from Todoist.
It looks stable again! 😀
Podcasts
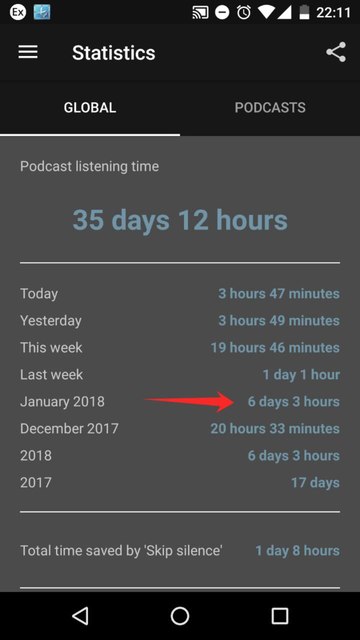
Here is my Podcast Addict stats:
6 days and 3 hours of podcast time is a personal record for me. Of course, I did not use 147 hours of my time to listen to Podcasts, I usually speed-up them, so I would guess it was around 60-70 hours. 😀
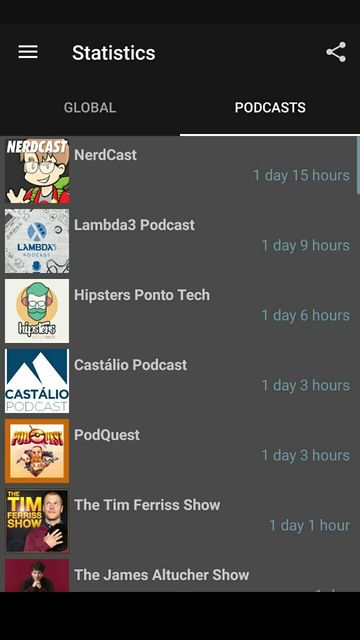
As usual, here is the list of Podcasts and their times:
Just remember that this is an “all-time list”, and I’m tracking time instead of the episode which makes short podcasts not to appear as “most listened” ones. I listen to CBN podcasts almost every day, but they are just some minutes long.
I would also want to highlight that I started listening to Philosophize this podcast and highly recommend you to try it. I decided to listen to 10 episodes in a row, starting from episode 1. I usually don’t read about philosophy because the literature is boring as hell, but this podcast explains all the good parts of it and makes it enjoyable to listen.
Hours working
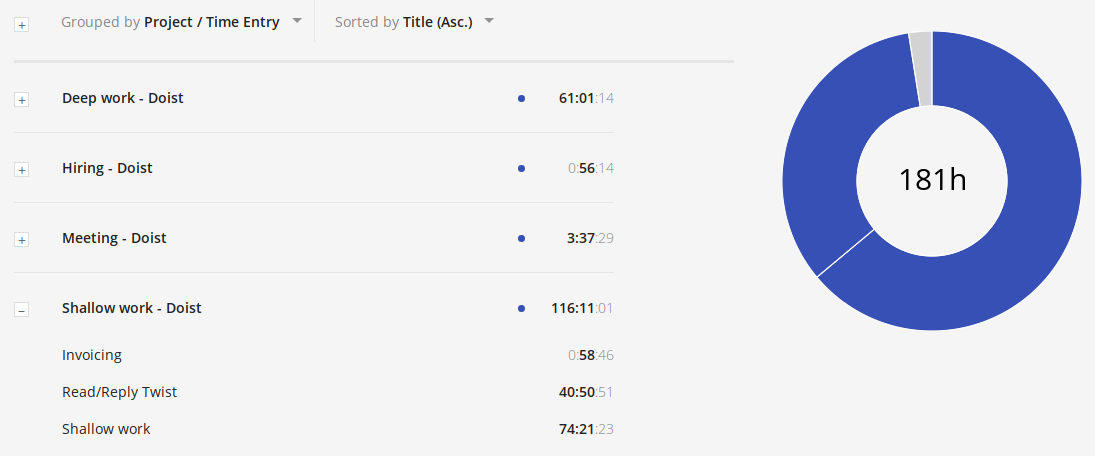
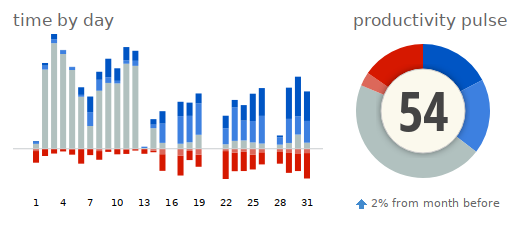
Here is the data from my time tracking software, Toggl comparing the last month (first) and this month (second):
I think I’m improving! I started to compute the number of hours I’m working in a day. Instead of working until I finish my tasks, I decided to set up 8 hours to work, and I have to work smarter to be able to include all tasks in this schedule. I highly recommend this strategy if you want to focus on your work and avoid over-working.
We had 21 work days this month, and I worked for 181 hours, which mean that I worked 13 hours more than I should. It was the same number of hours of the last month, but this time it looks more uniform in the chart.
What I can take from this chart:
- I had fewer meetings this month; this is definitely a good metric. 😀
- Had some time invested in hiring, but it’s probably done already! 😀
- Shallow work decreased from 60% to less than 50%, I’m thrilled to see that
“Read/Reply Twist” is still consuming a lot of time. I changed my workflow to process all Twist threads quickly and add Todoist task for them. After that, I can close Twist and focus on my tasks when I feel comfortable to research what needs to be done and reply to them. This workflow is not showing its results yet, but maybe we will have something next month. 😉
I will prepare a post about my workflow using Todoist and Twist soon.
Now, let’s continue to my personal projects:
That was a good improvement considering I did not have any time working on personal projects last month.
I decided to add my freelance to this chart so it will not interfere with my metrics from Doist. Here I have my freelance work and my talks.
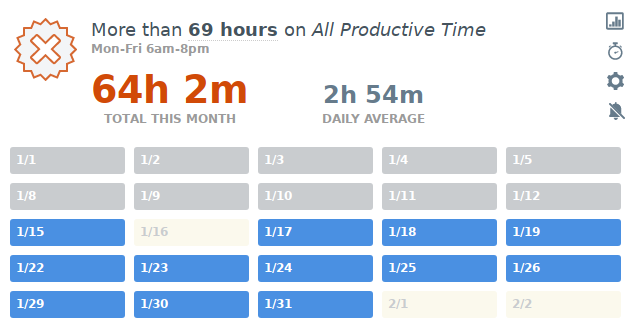
Here is my data from RescueTime:
I found out that something was not good with my reports. It was probably related to my change to Firefox quantum. I decided to get back to Chrome for a while, and I will try Firefox quantum again as soon as the third party plugins improve.
You can see in the chart the difference when it started reporting the websites again instead of just showing “firefox” as neutral time in gray.
Physical activity
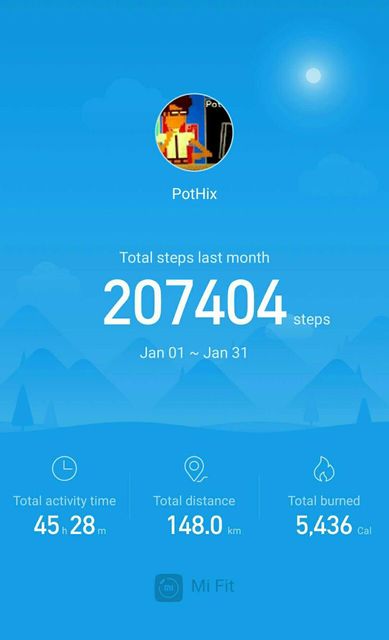
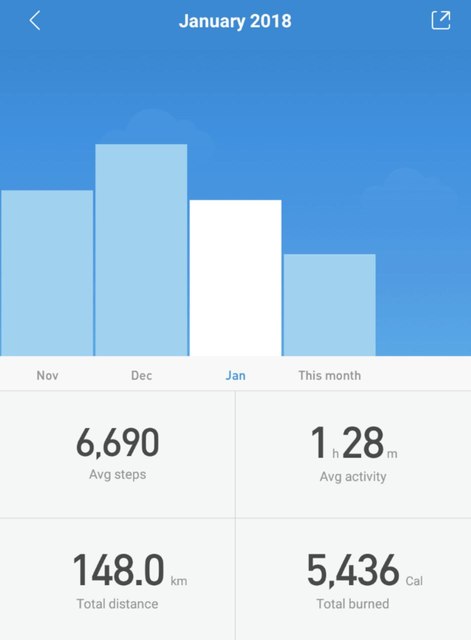
I’m using my Mi band data to calculate my average steps:
I got back to the average of 6.5k steps. Looking into the graph, it was almost the same as November (I was traveling in December, it should not count).
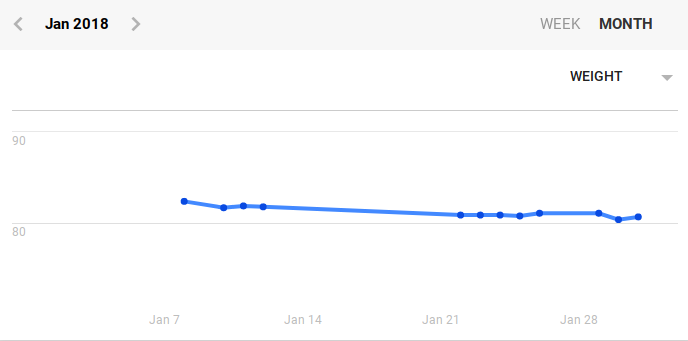
I’m back to the gym this month, and it’s reflecting in my weight:
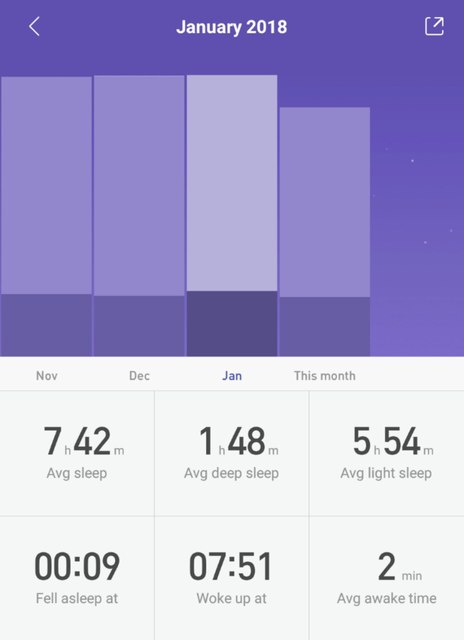
Here is my sleep data for this month:
As we can see in the chart, it’s almost the same but a little bit more deep sleep. 👍
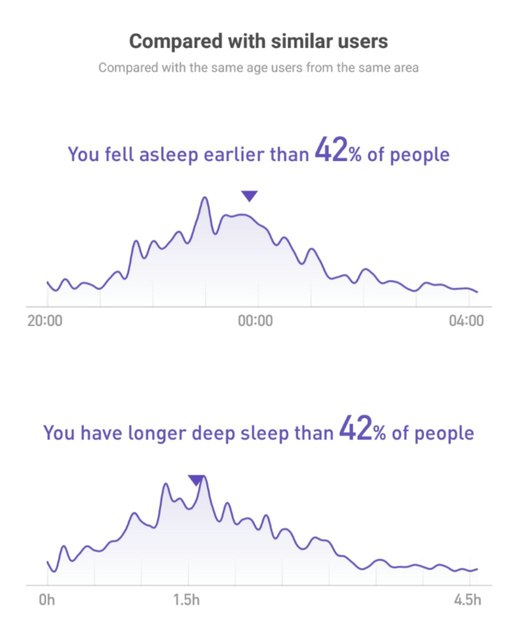
Considering the whole user base from mi-band:
My goal is to change this chart for the last month. I want to be above average for the sleeping earlier chart and hope to have more deep sleep.
TV Shows
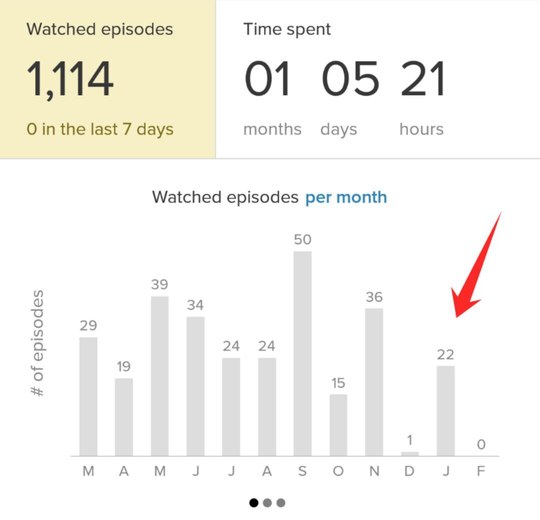
According to tvshowtime I watched 22 episode this month:
We finished the first season of Billions, finished the 4th season of Vikings, and started Punisher. 😀
I spent 19 hours of my life watching TV shows this month.
Words written and errors
I’m using Grammarly to improve my English and track the number of words and errors when I’m writing. Unfortunately, they only send weekly emails, but I will try to keep this metric for a while.
Here are my stats for this month:
- 71248 words written (93129 last month)
- 2039 corrections made (1380 last month)
- 12320 unique words (11979 last month)
I subscribed to Grammarly Premium; maybe this explains the increase in my number of corrections made, let’s wait for the next month to confirm.
Locations
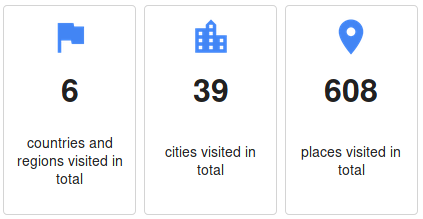
Let’s explore my locations. Last month first and this month right after it:
Just visited some places more but no new cities or countries. 😞
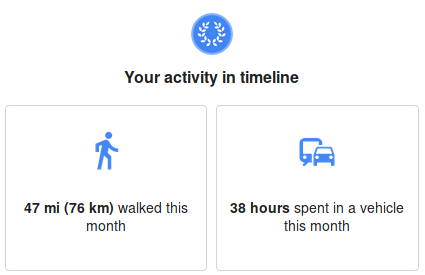
I’m back to my normal life with just a few hours spent in vehicles. 😀
Expenses
Here we go for what I was expecting! My expenses for this month! 😀
This chart represents all my income for this month. I was finally able to receive the money for my work! It was hard to work for many months without receiving any payment but finally I could manage to set up my company in the right way to receive the money. It is a long story and I should write about it in the future.
I received the money for my full-time job, my freelance, and for a presentation I did in a private company. It was the first time I received money for a talk in my entire life, after 40+ talks. 😀
Now looking at the pie chart, I can realize that I’m traveling a lot. I don’t think it’s a bad thing at all. I usually take care of my expenses when traveling so I can do frugal travels, but the airplane tickets are usually expensive. I also think the chart is like that because I don’t spend that much money in my day-to-day life, so when I have expenses that are not common, it dominates the entire chart.
I’m not considering the money in transit from my company to my personal account (waiting for money exchange, taxes payment and so on). So, without considering it, my total savings increased by f*cking 13.46%! Now I have 85.70% of my goal.
I’m feeling really good to see my savings growing again! 😀
Time to write this blog post
Some people are asking me about how much time it takes to collect all the data and write the blog post, so I decided to add this metric
It took 4 hours and 02 minutes to write this post
Conclusion
Back to the old routine and now with a cash flow again. 🙂
I’m finally engaging in the same optimized routine I had in the past, and I’m glad to see that happening again. 🚀


