10 minutes reading | Também disponível em 🇧🇷
Stats for Jun, 2018
Guess what!? Yes, metrics for June! 📊
Books
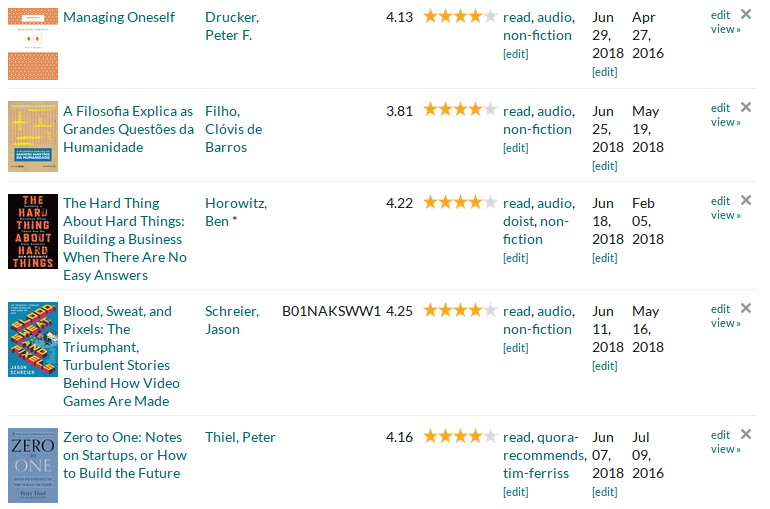
I usually don’t count how many books I read, I just track and check at the end of the month. When I saw that I read five books read this month, my face was like 😱. All of them received a 4-star review, so the result is quite good.
- Managing Oneself: This is a great book. It’s not life-changing, but there are many great tips to improve your life. It was almost 5 stars for me. Check my review to find my notes.
- A Filosofia Explica as Grandes Questões da Humanidade: This book is in pt-BR, if you speak Portuguese and want a light (and quite funny) introduction to philosophy book, this may be the one.
- The Hard Thing About Hard Things: Building a Business When There Are No Easy Answers: A good book for CTOs. It was also an excellent reading for me since I saw many of those problems happening during my career 😅. I’m not sure if I’m the right audience, but it’s a good book overall. Here is my review and notes.
- Blood, Sweat, and Pixels: The Triumphant, Turbulent Stories Behind How Video Games Are Made: If you like games, especially what is under the hood (not just to play them) you will have a good time reading this book. I’m a big fan of games and always try to build my own just for fun. The gaming industry is tough, you will understand why by reading this book.
- Zero to One: Notes on Startups, or How to Build the Future: A good one but I think I had high expectations. I recommend reading anyway, especially if you want to build a startup in the future (or already have one).
Note: I write a full review for all books I read. Sometimes I mention some of them here, but you can find all of them on my Goodreads account.
Articles
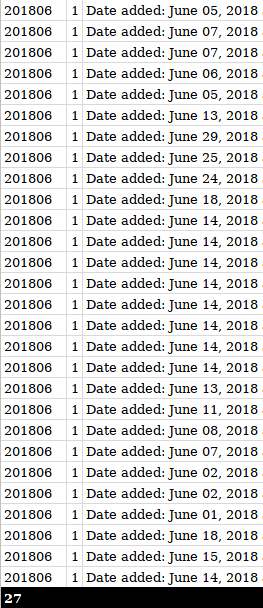
I’m still experimenting with an integration between Pocket and Google Spreadsheets via IFTTT. I’m adding a tag to the articles I read and want to include in my list of articles read for the month.
I use a SUMIF to sum all lines containing the YEARMONTH tag and it
shows I got 27 articles read.
Let’s compare this with the old method:
var pocket = {"unread":1539,"unread_pct":2.47,"read":1146,"read_pct":4.36}

var uls=document.body.getElementsByTagName("ul");
unread = uls[0].children.length;
pocket["unread_pct"] = +((1 - pocket["unread"] / unread) * 100).toFixed(2);
pocket["unread"] = unread;
read = uls[1].children.length;
pocket["read_pct"] = +((1 - pocket["read"] / read) * 100).toFixed(2);
pocket["read"] = uls[1].children.length;
console.log("# Result: " + JSON.stringify(pocket))

# Result: {"unread":1573,"unread_pct":2.16,"read":1173,"read_pct":2.3}
It means I have 1573 articles unread and 1173 articles read. Comparing with my results from the last month (1539 unread and 1146 read), I got around 2.16% more unread articles and 2.3% more read articles.
1173 (read this month) - 1146 (read prev. month) = 27 (the number in the spreadsheet)
It seems my spreadsheet tracking is working as expected. 🎉 I have to think if it’s a good thing to lose the number of articles added, but I’m not sure if it’s bringing that much value in the current situation.
Coding
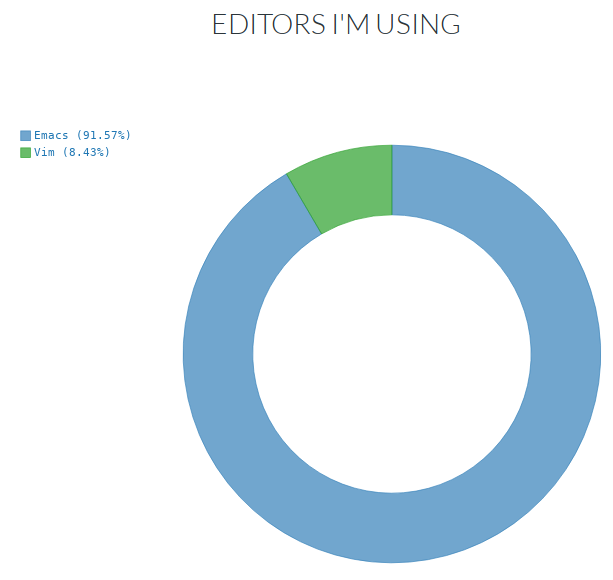
Here are the charts from Wakatime since the last post. I will start with editors this time:
Emacs is superior this month. I don’t remember seeing any uptrend during the month though. 🤔
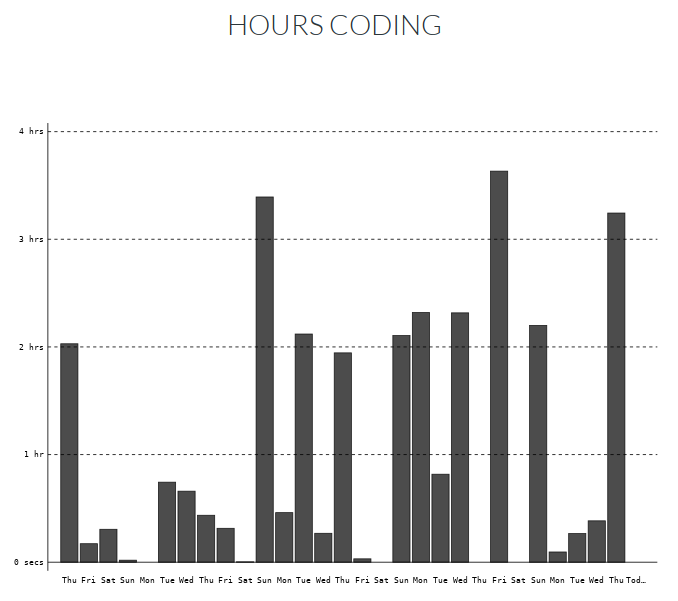
It’s better than the other months. It’s interesting to see that Sunday
was one of the days I programmed the most. 🤔 Usually, it’s related to
my presentations (rehearsing live coding) or writing this blog post,
which makes markdown to be on the top of the list of languages. 😅
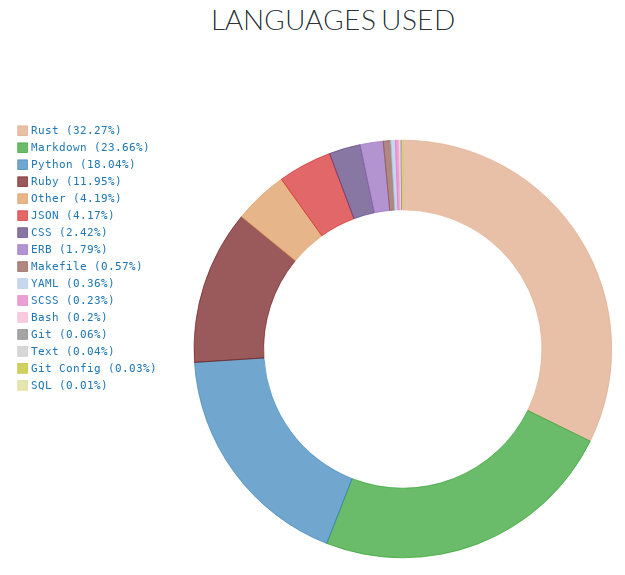
And now we have a surprise! Rust is the most used language this month with more than 32% of my usage. 😱
The reason for that is my gaming with Rust presentation this month. I plan to do some live coding, in the same way, I did for Python, Javascript, and Ruby in the past. It is taking almost all my spare time, but it’s also a ton of fun.
Thanks to my monthly posts and lengthy posts on Twist (that I write in Emacs), Markdown is in the second position.
Python is my first language nowadays and Ruby is used when I work as a freelancer full-stack developer (for the same company, for more than 2 years now).
Speaking
This month I spoke about the same topic as my book at Impacta tecnologia.
Still related to this presentation: this month also marks the milestone of 1000 copies of my book sold, which is incredible. I promised to write about it, hope to have a post soon.
Completed tasks
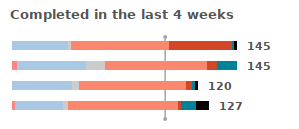
Here is the comparison of the tasks for the last month (first) and the tasks for this month (second). I extracted it from Todoist.
This time I could take the screenshot at the right time so we can compare. It seems stable, but I can see an improvement there. It is quite unreliable to use the number of tasks as it can be “drink water” or “implement a complex system”, but I’m OK with that. 😀
Podcasts
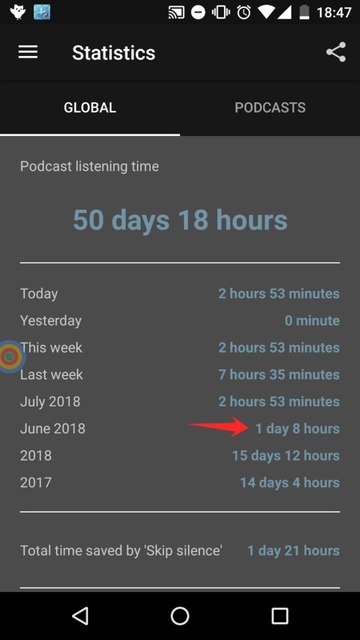
Here is my Podcast Addict stats:
1 days and 8 hours of podcast time. A little bit less than the last month, but as usual, the decrease of time listening Podcast correlates a lot with the number of books read (listen). 👍
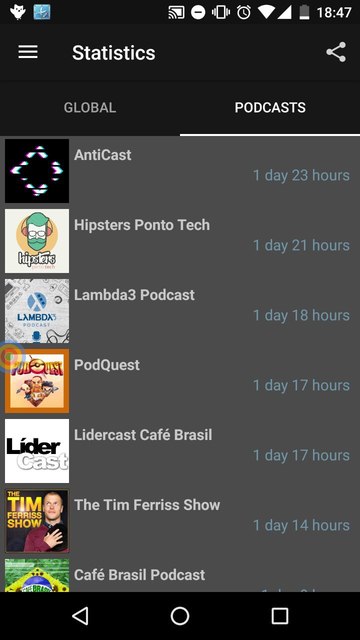
Here is the list of Podcasts and their times:
I’m not entirely comfortable with this list. It doesn’t tell a true story. I listen to many good and small podcasts, and they are not part of this list because the long ones usually take their place. As an example, I listen to CBN podcasts almost every day, but they are just some minutes long.
I’m keeping this list here because it shows some of the Podcasts I follow, but I will probably find the best way to do that. I will probably export a file every month and post it here. 👍
Hours working
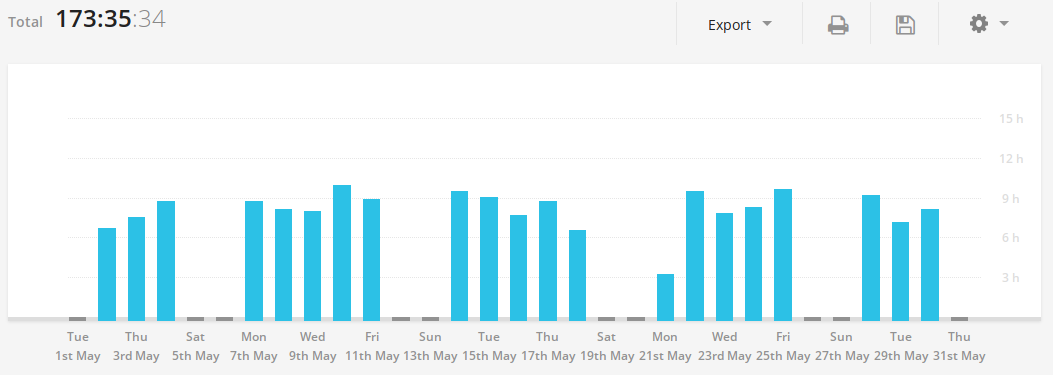
Here is the data from my time tracking software (Toggl) comparing the last month (first) and this month (second):
June 21st I was at AWS Summit São Paulo 2018.
I had 19 work days tracked this month, and I worked for 160 hours, which mean that I worked 8 hours more than I should (more than I had last month, which was 5 hours). It’s quite bad since I worked 1 day more than I should. The goal is to reach 8 hours and remove those bars that exceed the 9h threshold. Currently, it’s not a huge problem, but I want to be able to stabilize it.
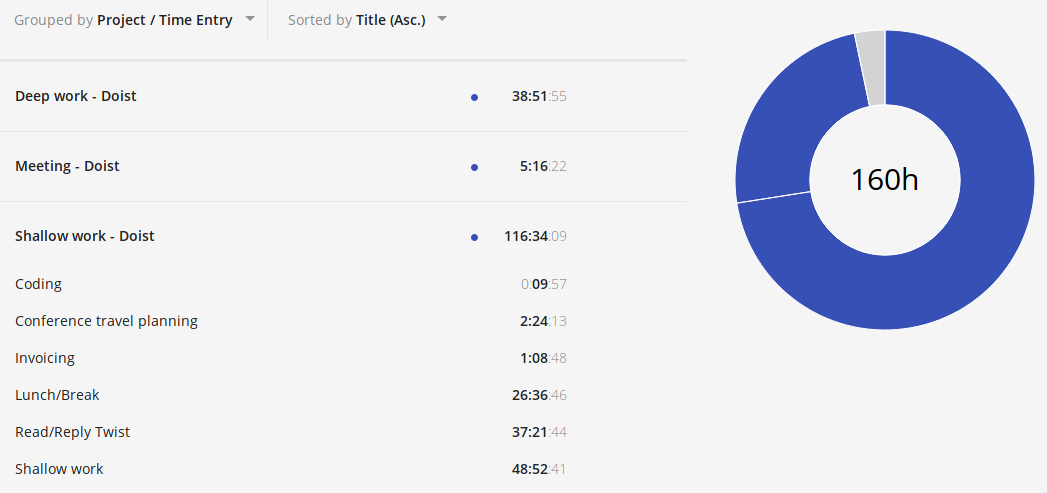
Let’s check Deep work versus Shallow work:
Last month I was discussing each item of the Deep work, but I will get back to discussing Shallow work only since it’s what concerns me the most. Deep work is useful, sometimes it’s not coding, but it’s related and meaningful work.
For shallow work, we have:
- Meeting time is stable (and productive), considering two 1-1 meetings (1 hour each) and four weekly meetings (around 40 minutes each)
- Read/Reply Twist is stable but still consuming much time, more than 2 hours every day.
- Lunch/Break is now complete! I’m spending around 26 hours in lunch/break. Considering that I had 19 days of work, it’s less than 1.5 hours. I should stop and stretch more than I’m doing now.
Let’s check the Twist usage by hour (previous month first, this month after):
No significant changes, and as I said in my previous review, I’m not that satisfied with this chart. The perfect chart for me would have a small peak at 9-10, almost no usage between 10-13, a giant peak between 14 and 16 and less usage from 16 to 21. That performance is what would be more productive to me according to the daily when tracker.
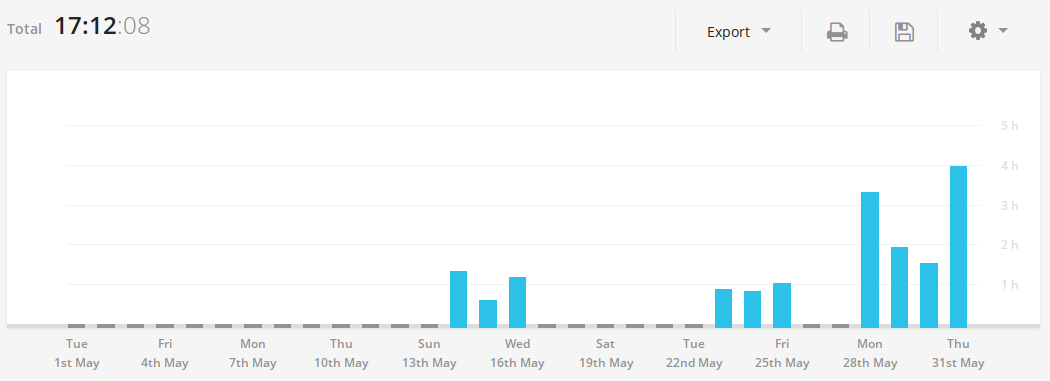
Now, let’s continue with my personal projects, last month first and this month last:
What an improvement! It’s probably related to my presentation since I’m rehearsing it a lot. 😅
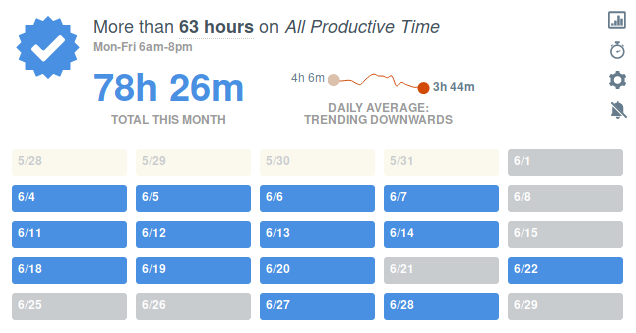
Here is my data from RescueTime:
My pulse is worst this month. I’m still tracking my Telegram usage since it’s the most used application of the Very distracting category. Here is the comparison from the previous month to the current one:
It seems the usage increased. I don’t know why yet.
Comparing Telegram usage by time of the day, we have (last month first, this month second):
It’s not that used in my peak times, but it seems to be the opposite of Twist usage. I have to work on that.
Physical activity
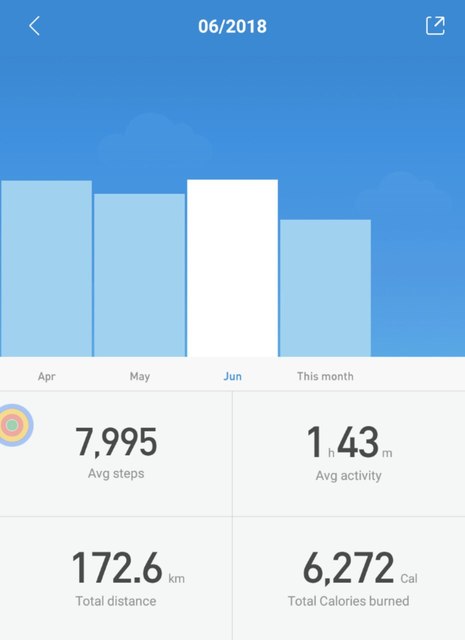
I’m using my Mi band data to calculate my average steps:
This month I have almost 8k steps compared to 7k from the previous month. 🎉
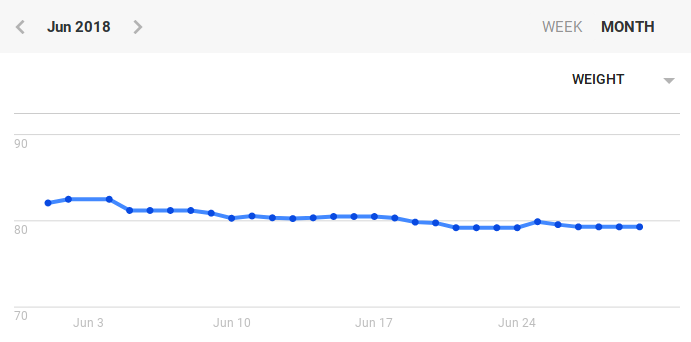
Let’s check my weight:
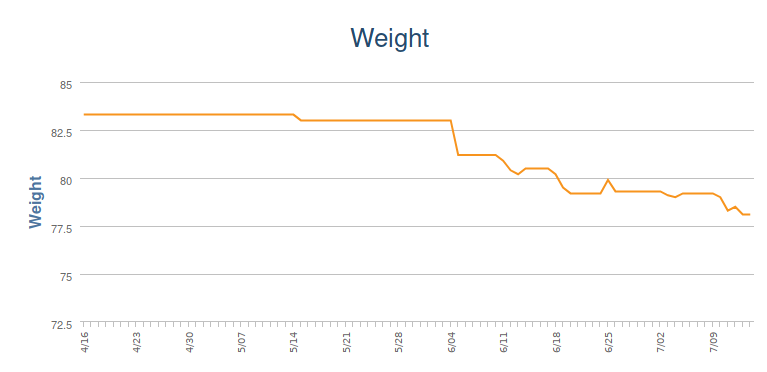
It’s nice, but it doesn’t show what I want. If you look by the 90 days perspective using MyFitnessPal, we have a better picture of that:
My plan to lose a little bit of weight is finally on the way. 👍
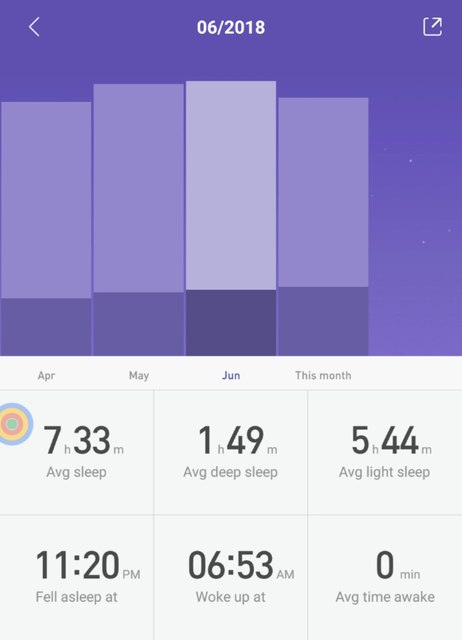
Here is my sleep data for this month:
Good to see it’s improving every month. 🙃
TV Shows
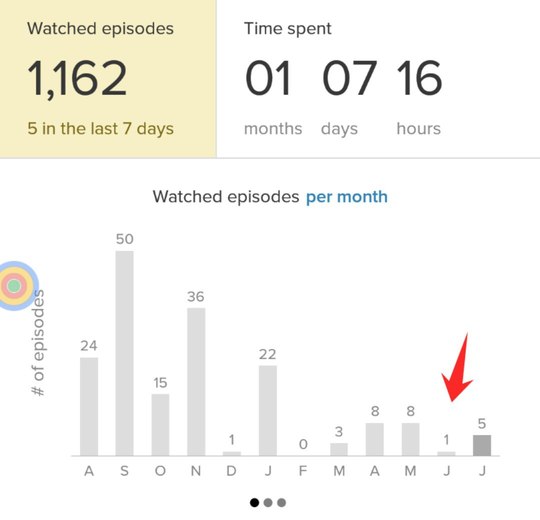
According to tvshowtime, I watched just 1 episode this month:
It’s probably related to the last episode of Sense 8.
I forgot to get my data from trakt.tv at the beginning of this month. The current version already includes some other TV shows. I will keep last month’s version here for reference.
[ ](/images/stats/2018/jun/tvshows-trakt.jpg “)
The most important part is in blue:
- TV Shows: 31d 22h 50m
- Movies: 10d 15h 22m
Words written and errors
I’m using Grammarly to improve my English and track the number of words and errors when I’m writing. Unfortunately, they only send weekly emails, but I will try to keep this metric for a while.
Here are my stats for this month:
- 47147 words written (38747 last month)
- 595 corrections made (385 last month)
- 10973 unique words (11213 last month)
It seems that I’m writing more but not with a better vocabulary 😞. I’m not sure if it’s related to the fact that I’m not tracking everything I type in Twist anymore. 🤔
Locations
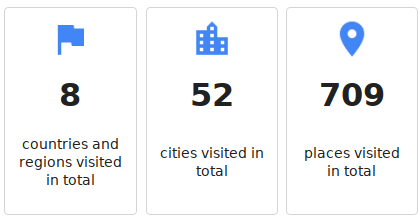
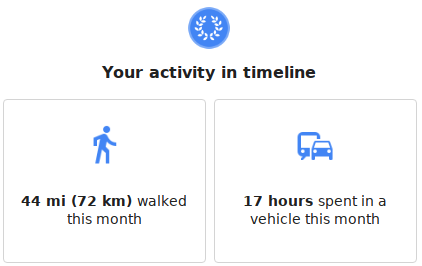
Let’s compare the previous and this month, the previous first and this month right after it:
One new city popped out, and according to Google locations, it’s São Paulo 🤔.
A little bit more time in a vehicle. It seems that I’m getting out of the cavern more nowadays 😅
Still many kilometers to “reach the moon”:
Expenses
It’s time to check my expenses! 💰
This month I spend 29% of my earnings, which is still below my expectations (40%). This 29% are distributed into the following categories (in pt-BR):
I see more general expenses (Compras) than I would like. Gifts and donations ( Presentes / Doações) are quite high this month because of my parents in law health insurance. I decided to add it to the donations category because I’m already using the Family one (Família / Filhos) to track the expenses with my dog. 😅
We spent a lot with Doctors and medicines this month (Saúde), but I hope it will not be a recurrent expense.
My total savings increased by 1.32% this month, and now I have 95.35% of my goal.
Time to write this blog post
It’s an important metric to understand if it worth taking the time to write it. So:
It took 3 hours and 40 minutes to write it
It was a good time considering my average. 🎉
Conclusion
It was quite hard to take the time to write down this post, but I’m glad I did it. I feel excellent when I read my accomplishments every month. ☺
See you next month. 🖖
