8 minutes reading | Também disponível em 🇧🇷
Stats for Jul, 2017
Okay, here we go for the first full month working in my new job. :)
Books
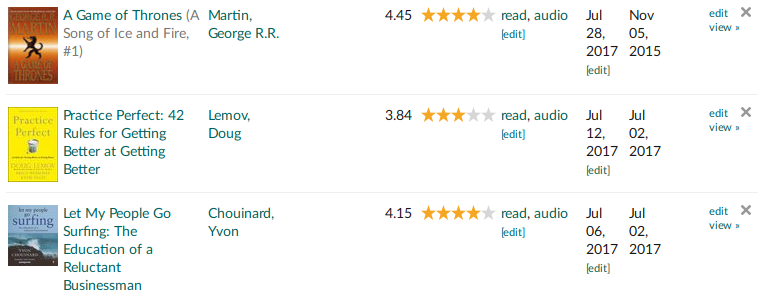
This month I read Let My People Go Surfing: The Education of a Reluctant Businessman, which was recommended by the other Doisters. It’s a great book by the guy who built the company Patagonia, a bootstrapped company, from scratch. Their way of thinking looks a lot like the way we think at Doist.
The second one is Practice Perfect: 42 Rules for Getting Better at Getting Better. I bought this book on Audible daily deal and it surprised me in a good way. It was made for teachers in the beginning but was changed for the general public. You can still feel the education background but it is not a bad thing for me. I found some good strategies my teachers used on me when I was on college.
The 7th season of Game of Thrones just started and I decided to read A Game of Thrones, the fist book of A Song of Ice and Fire. After reading it I found the 1st season to be really loyal to the books, which is really nice. If you, like me, enjoys the TV show a lot, I really recommend reading. There are some background and feelings you understand better when reading the books. I hope to start the next one soon.
Articles
As usual, I’m using that same export file from Pocket and the same script to calculate the amount of articles I read:
var uls=document.body.getElementsByTagName("ul");
for(var i=0; i<uls.length; i++) {
    console.log(uls[i].children.length)
}
1044
777
It means I have 1044 articles Unread and 777 articles Read. Comparing with my results from the last month (968 unread and 708 read), I got around 8% more unread articles and 9% more read articles.
It improved a little bit compared to last month but the unread count is still growing which means I will probably never read many of those articles. =/
Coding
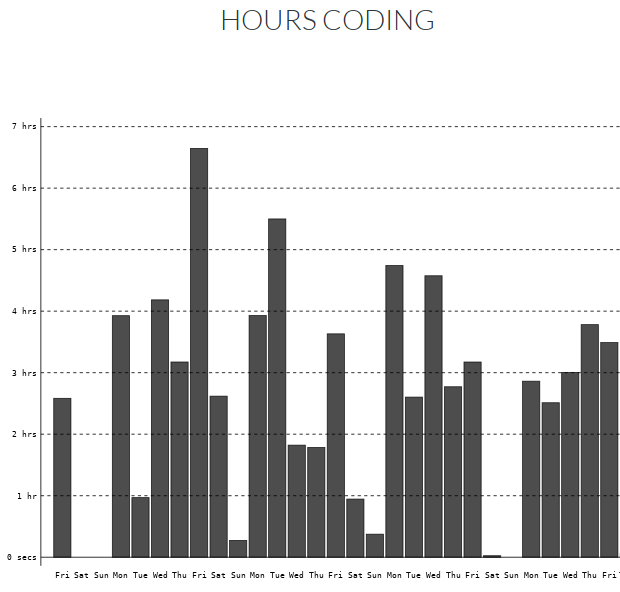
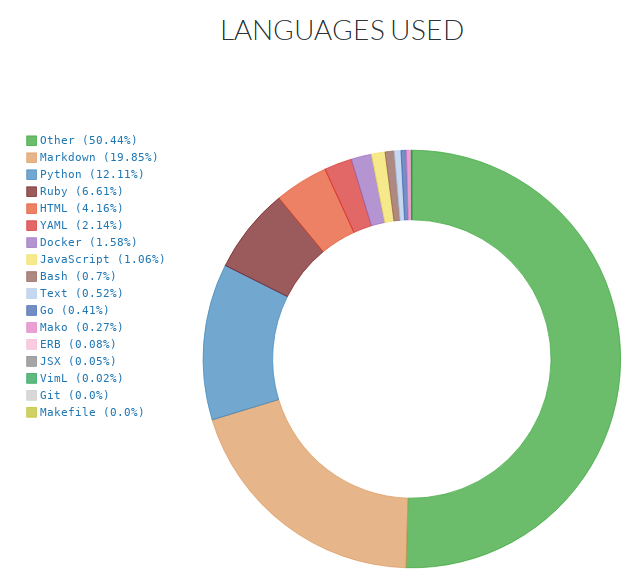
Here goes the charts from Wakatime since the last post.
Nothing new here. I have one big peak of almost 7 hours of coding but the rest is stable.
I’m still fixing some docs and get all the projects up and running, so I still
have a lot of bash and some markdown, but Python is growing.
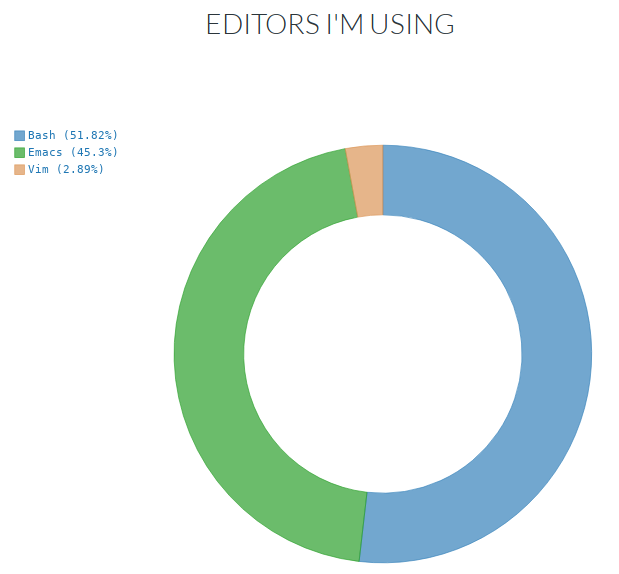
Editors are pretty much the same as last month’s.
Speaking
- Deconstructing the web at Virada Tecnológica
- Building a snake game live and from scratch with Ruby at Guru-SP
- Building CLIs with Golang at The Developers Conference
- Building a game live and from scratch with a browser and a text editor at The Developers Conference
- Your ruby app end to end at The Developers Conference
- Deconstructing the web as a Guest speaker at ELO7 Tech-talks
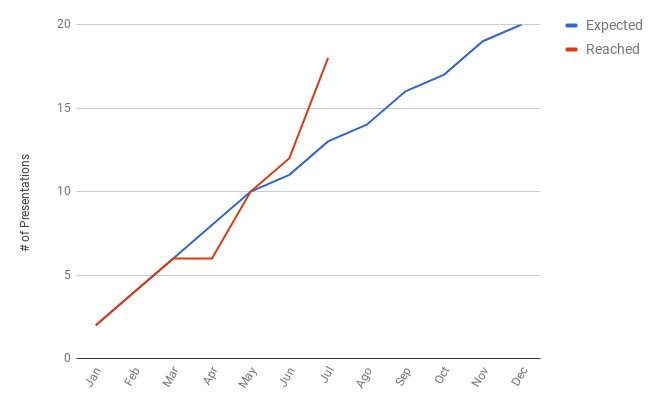
Six presentations in one month. Three of them were in the same day. This month is a personal record for me. 🎉
It was also a huge step towards my goal:
Hm… I kinda finished the yearly challenge in July. 😬
Let’s see how far I can go! :D
Completed tasks
I want to add the amount of tasks completed on Todoist.
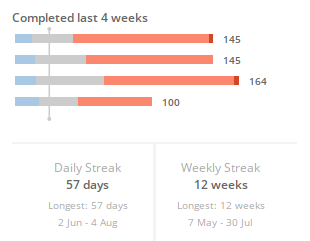
554 tasks completed this month. :D
I also included my streaks but I think I will have to improve my daily goals, they are too small for me.
I have plans to create a better way to extract data from my Todoist account, but I will need some time to work on it.
Podcasts
Here is my Podcast Addict stats:
2 days and 18 hours of podcast time, that’s a lot. :)
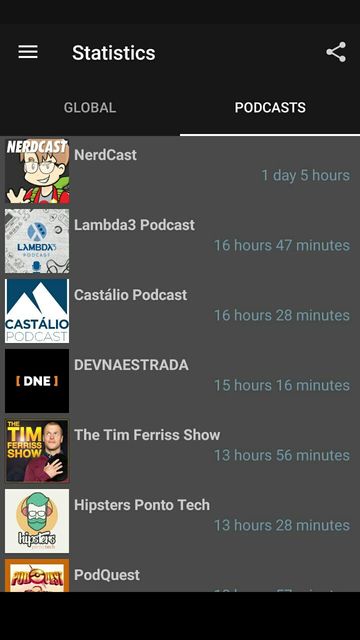
I decided to keep a list of the Podcasts and their times as well.
Just for the record, this is an “all time list” and I’m tracking time instead of episode which makes short podcasts to not appear as “most listened” ones. I listen to CBN podcasts almost every day, but they are just some minutes long.
Castalio Podcast is going up every month. I was a guest on their podcast, btw! :D
Hours working
Here is the data from my time tracking software, Toggl:
The above chart is just for my freelance and full-time job. My full-time job is taking all my energy currently and there is not so much time spent working as a freelancer this month. The good part is that I’m working a lot less than the previous months but I’m exhausted in the same way.
I’ve changed the way I’m tracking my projects and now I can see the difference between Deep Work and Shallow work in a better way:
It’s nice to see that I’m spending 1/3 of my time in Deep Work state. :)
There is another chart for my personal projects:
It was really hard to work on personal projects this month. This 11 hours was my presentations. I did not consider the whole day speaking at TDC though. :)
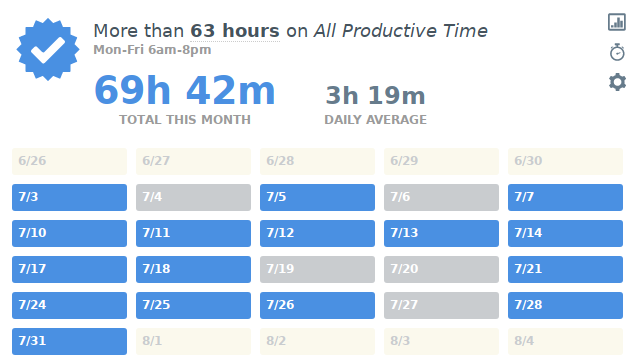
Here is my data from RescueTime:
Another month reaching my productivity goal! :D
The only month I reached my goal before joining Doist was March, the month right after my vacations, and now it’s the second month in a row. Hope to keep it.
Physical activity
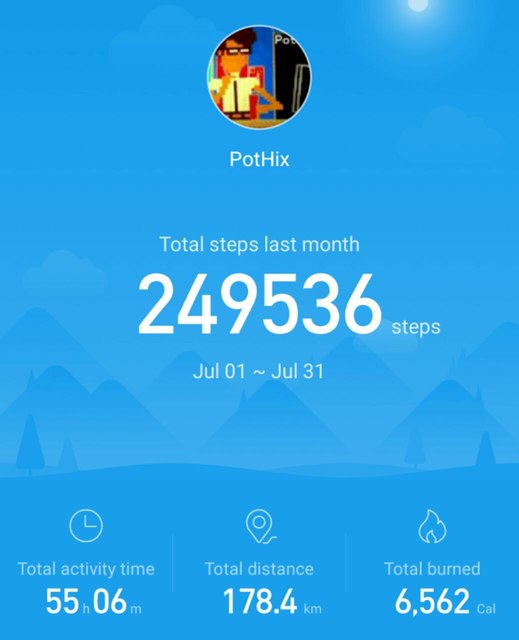
I’m using my Mi band data to calculate my average steps:
According to this data, I can conclude that I had a daily average of 8k steps (249/31), it came back to my previous average.
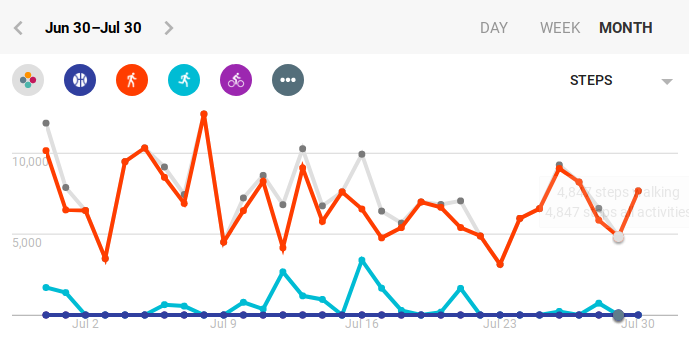
And these are my steps each day:
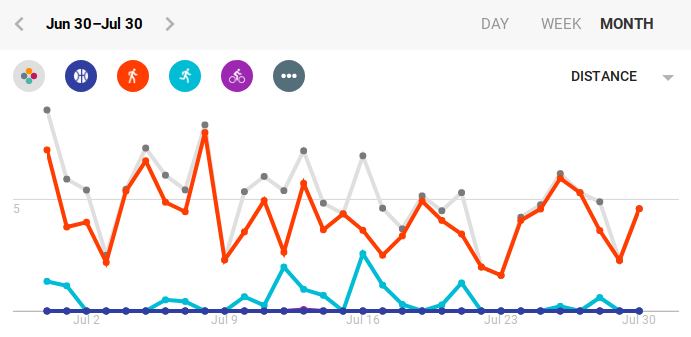
My max distance was 8.3km:
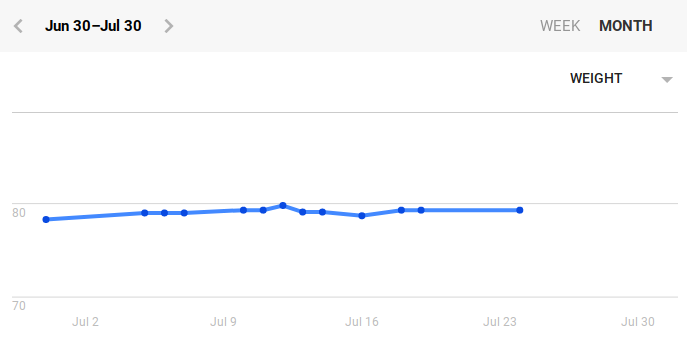
Some more weight but not so much:
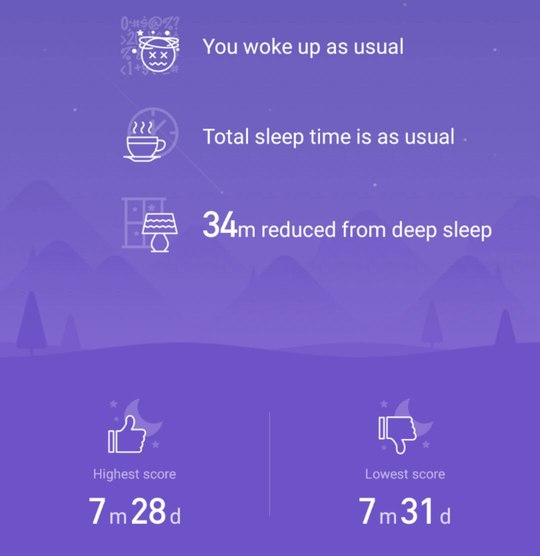
MiFit app interface for sleep data changed a little bit but here is my data for this month:
A bit more average sleeping (7h29m for the last month) and a lot more deep sleeping for this month \o/ (last month was 1h04).
I bought the Mi band 2, it may have some better monitoring. Let’s see how it goes for the next month. :)
There’s a new feature comparing my stats to the user base:
I liked it. :)
TV Shows
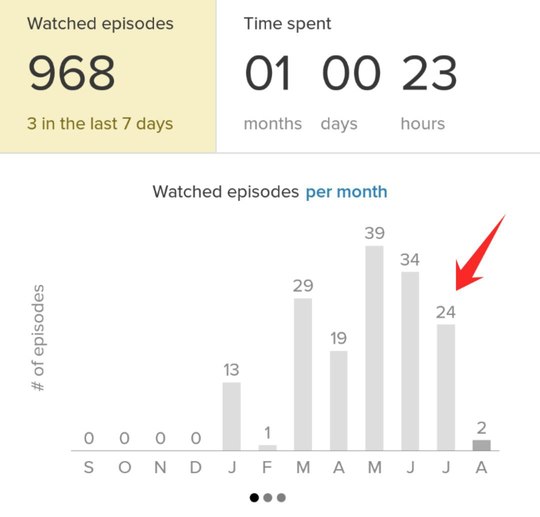
According to tvshowtime I watched 24 episodes this month.
It’s a combination of the two seasons of Mr. Robot (really recommended for programmers, BTW), American Gods, and Game of Thrones.
I spent 20 hours watching TV this month.
Words written and errors
I’m using Grammarly to improve my English and track the amount of words and errors when I’m writting. Unfortunately, they only send weekly emails, but I will try to keep this metric for a while.
Here are my stats for this month:
- 51018 words written (34156 last month)
- 1272 corrections made (634 last month)
- 10485 unique words (10332 last month)
Since all my work conversations are in English, I have a lot more data here. Less unique words than last month (🤔) but almost 1/3 more words. The bad part is the corrections made, 2x more than last month. =/
Locations
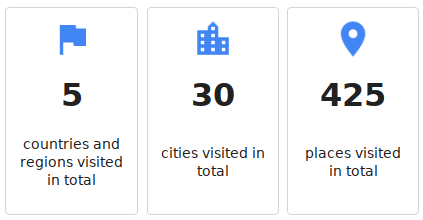
Again, for some reason 1 city is gone from my timeline, that’s weird. In the other hand, the amount of places I visited increased by 14. I’m not sure if I can trust on this data from Google Maps.
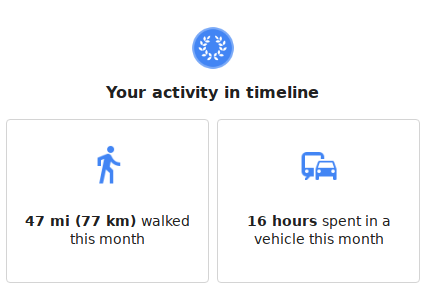
I also decided to add the amount of time spent in a vehicle this month:
My presentations increased the time spent on transport, I think. I don’t know if I can trust on the distance walking.
But still, 16 hours in transport for the whole month! Remote work FTW!
Here is a funny metric:
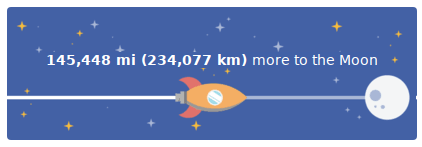
The time I have to walk to “get to the moon”, LOL.
Expenses
My expenses for this month:
This chart represents all my income for this month. As predicted last month, I did not receive anything because I was still waiting for the whole process to get my company ready to generate invoices. It took almost two months to complete but I think it’s done and I can finally generate new invoices to receive my payment.
Most part of my expenses goes to “Despesas do trabalho” (work expenses), since I had to pay a lot of taxes to get my own company ready.
It was amazing to find that I still increased my total savings by 0.5% (not so much compared to 5.2% of the last month, but it’s positive!) and reached 72.83% of my goal. It happened thanks to my wife supporting our expenses. ❤️
Time to write this blog post
Some people are asking me about how much time it take to collect all the data and write the blog post, so I decided to add this metric.
It took 3 hours to write this post
1 hour less than last month but I will still work to improve this time.
Conclusion
My new job is taking a lot of my energies. There is a lot of work to do and new stuff to learn. I’m doing my best to make the software I love since 2007 become a great platform to developers build their stuff on top of it.
I was not expecting to be so tired at the end of the day, I had to put some personal projects aside for some months.
Aside of that, the company and my co-workers are great, I’m really enjoying the experience of building a great product.
