4 minutes reading | Também disponível em 🇧🇷
Stats for January, 2017
This is the first post of a series that will show all the data I’ve been collecting during the month. One of my goals this year is to track everything possible. These posts will help me to analyze all the data and may extract something for me.
This is not a new idea, I’m inspired by posts like this from Matthew of truevalhalla.com.
Books
My goal is to read 30 books this year, so I must have an average of 2.5 books per month. I read two this month:
Outliers is a great book, I really recommend it. It talks about the 10.000 hours role to master something. The Memory Illusion is about how your mind trick you creating false memories.
Coding
To track my time coding I’m using Wakatime (this link is a referral, use it in case you want to try it out).
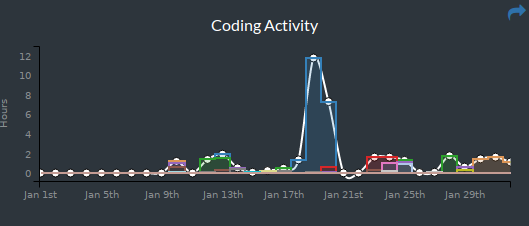
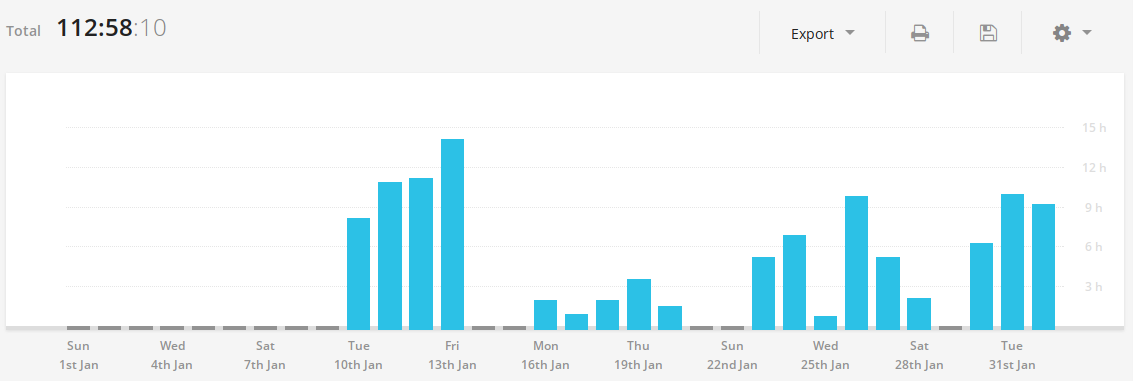
By using it I can see the amount of hours I spent programming:
Don’t worry about the colors in this chart, each project has it’s own color but it’s not relevant for this case. My best best day was Jan 19th, almost 12h coding.
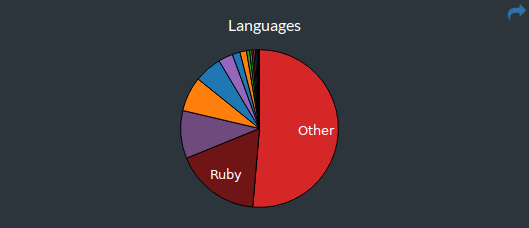
Now we can check the languages I’m using:
I have no idea what this “Other” means. The purple one is Elixir. I’m playing with it and it’s great.
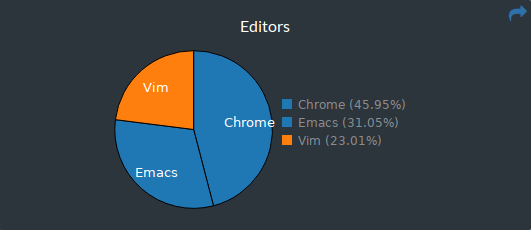
Here is the controversial fact. My text editors:
Forget about Chrome, I was testing a feature from Wakatime. But yes, I’m using both Vim and Emacs. :P
Speaking
I spoke three times this month, here is the list and descriptions:
- Campus Code, it was opening the Quero ser dev program. I was talking about the chooses we made as developers during our careers.
- Impacta, speaking about what what happens behind a web request. This is the presentation that inspired my book.
- Campus Code, after 6+ rehearsals I was trying my talk “Open source behind a web request” for an actual audience. It was my first talk in English.
Podcasts
I’m a big fan of audio programs. I have many audiobooks and podcasts in my collection and I listen to them whenever possible.
This is my stats for this month, thanks to Podcast Addict:
The big numbers is my total time, but look at the “January 2017” time.
Hours working
I’m testing Toggl to track my working hours. This is the first month and here are the results:
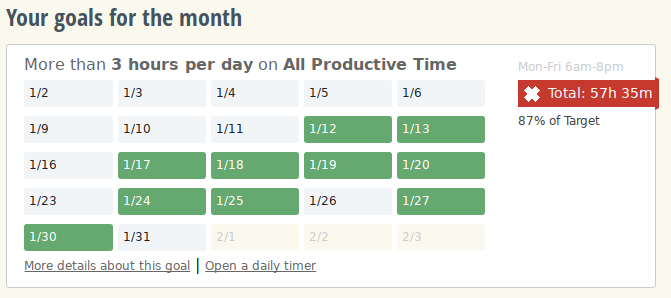
I’m also using RescueTime to track my apps on my cellphone and personal computer. It still needs some tuning but here are my goal of 3 productive hours per day:
I will work on that.
Physical activity
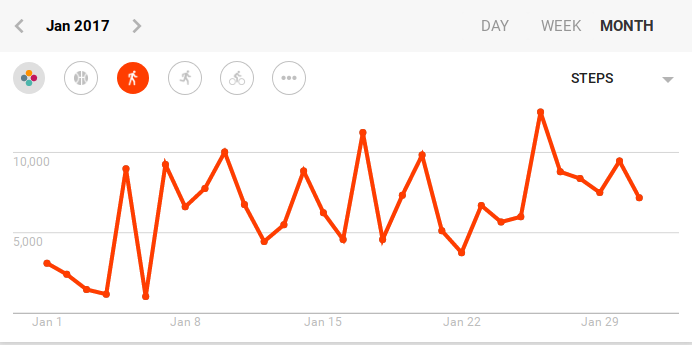
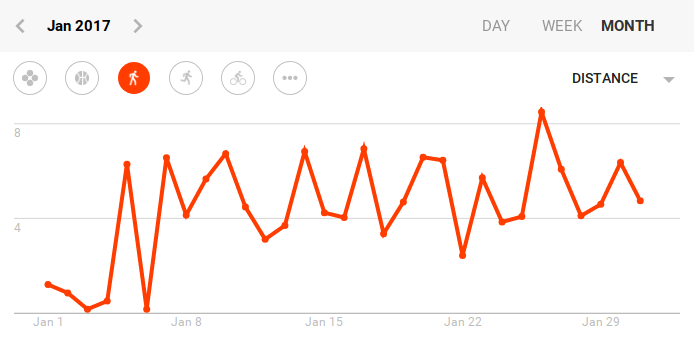
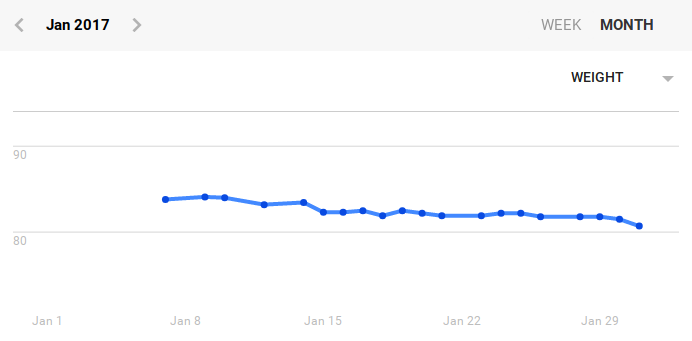
I try to keep a regular physical activity. After buying a simple and cheap Mi band I can track it better. It’s integrated with Google Fit, so I can extract all those nice charts.
This is the amount of steps this month:
Distance by day:
And I’m also tracking my weight, which is improving! :)
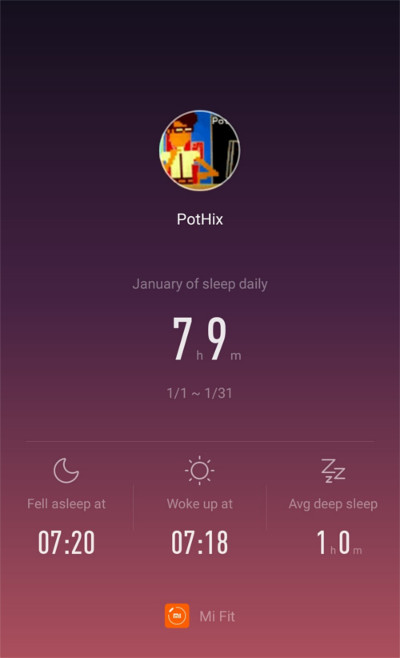
By using miband, I can also track the amount of sleep for this month:
Unfortunately this app does not know how to deal with sleep time when you sleep after midnight. This is the main reason why it says I’m going to sleep at 07:20 and I’m waking up 07:18 (???). I will workaround this bug by avoiding to sleep after midnight, as I’m waking up around 6. :P
TV Shows
I don’t watch so much TV but it’s a hobby of mine (and my wife) to watch TV Shows on Netflix. We also watch Game of thrones on HBO when available.
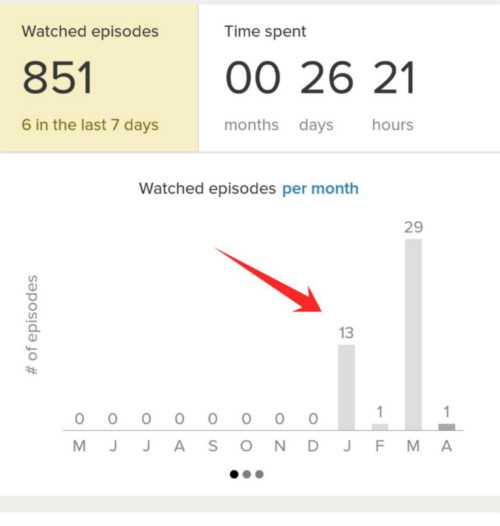
I’m using tvshowtime to track it and here is my stats for this month:
Expenses
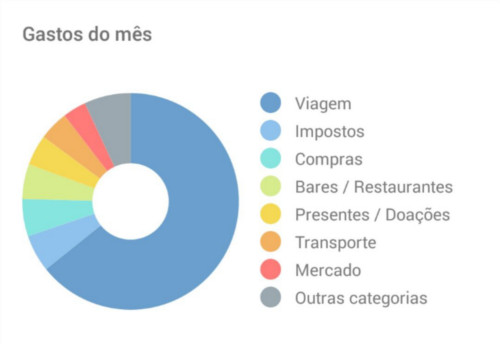
This is something I’m planning to do for a long time now but never got the chance. I always keep track of my expenses and now I decided to publish here as well. It will not have values (because it don’t need to), but here is the chart for my expenses by category:
Yeah, I know, all categories in pt-BR. This chart comes from a Brazilian app called GuiaBolso and it’s the best I have for the moment. As you may expect, it takes a lot of time to collect all these data, so I will keep it as is for a while.
Most part of my expenses was covering the travel expenses for my Eurotrip next of February.
Conclusion
This is the first post, so there are many details missing. The idea is to start “simple” and keep improving in the next months. As it’s not so easy to write posts like these, I’m trying to create some “templates” for it.
It was a pretty good experience to see all that data together. :)
Let’s see how it goes in the next months.

