10 minutes reading | Também disponível em 🇧🇷
Stats for Feb, 2018
February time! Let’s see what we can get from my metrics. 😀
Books
Note: I write a review for each book I read. You can find them on my Goodreads account.
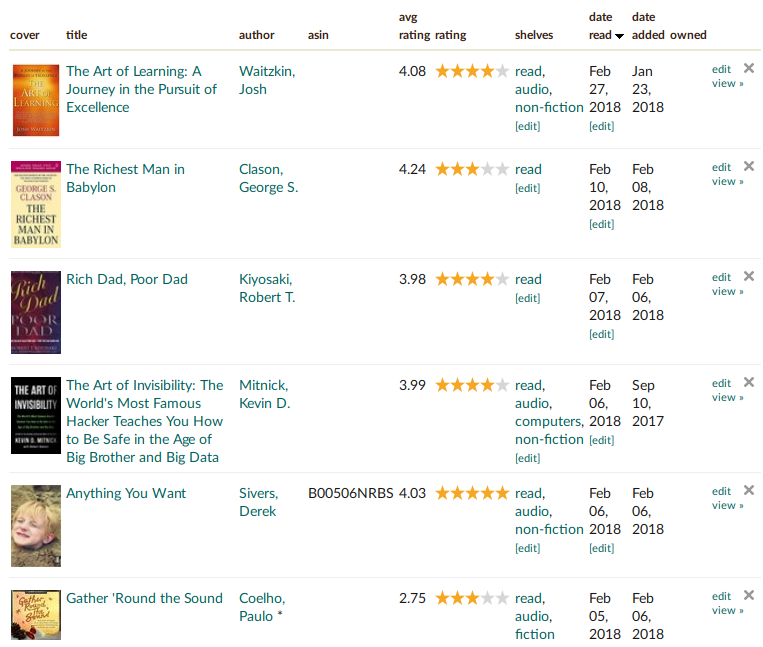
I’m quite satisfied with my reading list for this month:
Five books read in a month and a 4.6 average rating. That’s what I call a good reading month.
The Art of Learning: A Journey in the Pursuit of Excellence. This was another fantastic recommendation by Amir. The author was a chess prodigy as a kid and an international chess master in the age of 16. He also was highly skilled in Martial arts. In this book, he shows what he extracted from his process of learning during all those years in physical and mental arts. You can read my review on Goodreads.
The Richest Man in Babylon. This book is a series of fiction stories using Babylon as the central topic. It’s a good book but “Rich Dad, Poor Dad” ruined it for me. Reason below.
Rich Dad, Poor Dad. It’s a great book. When I was reading it, I asked some friends why they did not recommend it before. There are some great ideas there (depending on your political opinions, you may not like it) and I saw many of them being applied in practice in my own life. It was almost a 5 stars review, but the ending was really dull. I felt he was trying to add more pages to the book.
The Art of Invisibility. This is the book that makes you paranoid about security (if you care about it). I recommend you to read it if you feel secure using the internet.
Anything You Want. An amazing book. Short, straight to the point, and with killer hints on how to Derek Sivers dealt with his business. I really recommend this one.
Gather ‘Round the Sound. This was a free audiobook by Audible. It was nice to listen but nothing astonishing.
Articles
As usual, I’m using that same export file from Pocket and a script that look like the one I used last month. Here is the script with the actual data:
var pocket = {"unread":1352,"unread_pct":4.14,"read":1008,"read_pct":6.15};

var uls=document.body.getElementsByTagName("ul");
unread = uls[0].children.length;
pocket["unread_pct"] = +((1 - pocket["unread"] / unread) * 100).toFixed(2);
pocket["unread"] = unread;
read = uls[1].children.length;
pocket["read_pct"] = +((1 - pocket["read"] / read) * 100).toFixed(2);
pocket["read"] = uls[1].children.length;
console.log("# Result: " + JSON.stringify(pocket))

# Result: {"unread":1420,"unread_pct":4.79,"read":1020,"read_pct":1.18}
It means I have 1420 articles unread and 1020 articles read. Comparing with my results from the last month (1352 unread and 1008 read), I got around 4.8% more unread articles and 1% more read articles.
It seems that my unread articles list is increasing. My list of unread increased by just 1%. I’m still reading but not enough to take care of the unread list.
I should probably consider not adding articles there anymore. I just have to consider if the feeling of adding items “for future reading” is worth keeping the system. More on that in the next months.
Coding
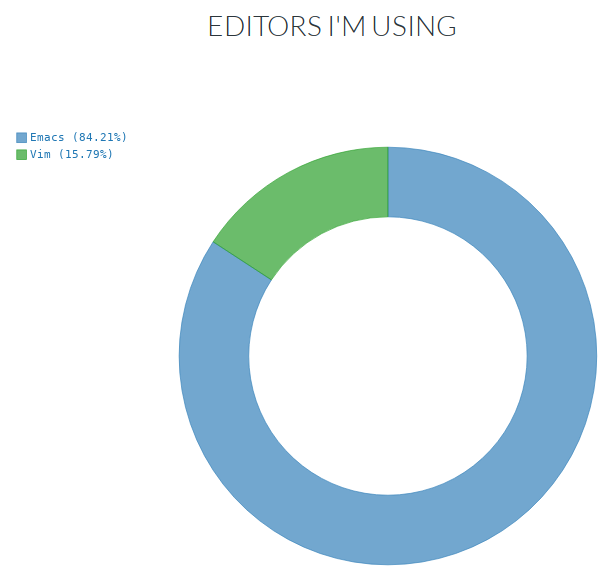
Here are the charts from Wakatime since the last post. I will start with editors this time:
My Vim configuration is fixed, and it’s back to 15%. 🙂
Unfortunately, the screenshot is not that good, and I’m just seeing that some days after taking it. I will keep it here.
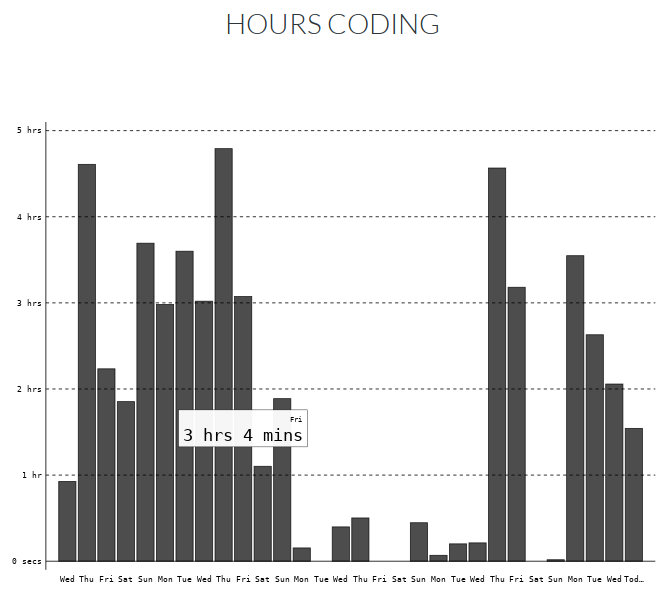
Looking at this chart is interesting. I had one week of vacation, that you can easily see in the middle of the chart, but after that, I had 3 days to catch up to a lot of non-coding work to do before going full-throttle again. I’m really interested to see if this is a pattern in the next holidays.
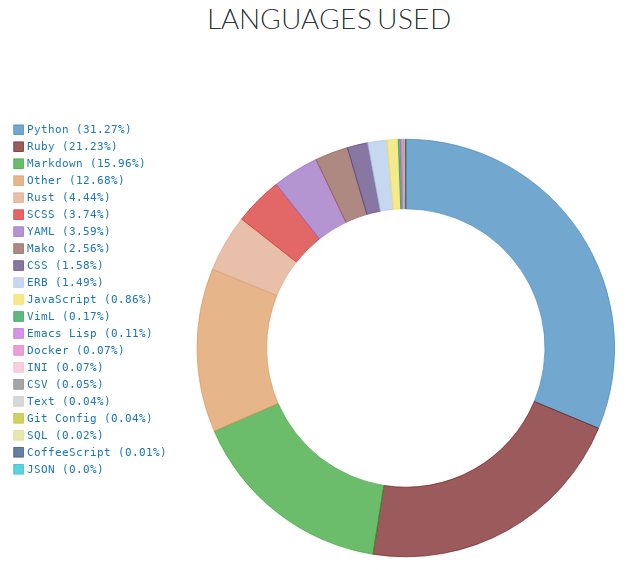
Finally, I have two programming languages at the top instead of markdown. :P
I’m not writing on Emacs these days, and this is probably the reason I don’t have so much markdown. Python is my first language but I had some Ruby as well. I’m quite happy with the results. Hope to have more Rust or
maybe Elixir in the next posts.
Speaking
I had one presentation at Impacta tecnologia this month. The title was Criando um snake game do zero com Ruby e Gosu. I built a simple game from scratch, teaching the simple flows of how to do that using Ruby. It was really nice for me, hope everyone enjoyed as much as I did.
You can always check my list of talks here.
I said that I submitted talks for two conferences last month and both were rejected. One of them was an excellent fit for the conference, IMO. I should probably improve my proposals and try again in the future. 🙂
Completed tasks
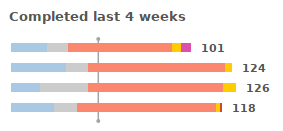
Here is the comparison of the tasks for the last month (first) and the tasks for this month (second). It was extracted from Todoist.
It’s reflecting my vacation, but I can see I completed much more tasks as soon as I got back. If we compare with the amount of coding I did, it tells me that I had many tasks to do, but they were not related to coding. 🤔
It’s good to know that because it makes me feel better when there are not so many commits done. 👍
Podcasts
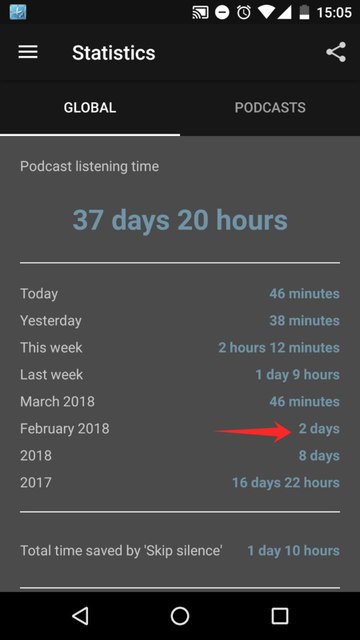
Here is my Podcast Addict stats:
2 days of podcast time is the average for me. As usual, it is the opposite of the number of books I “read” (listened to).
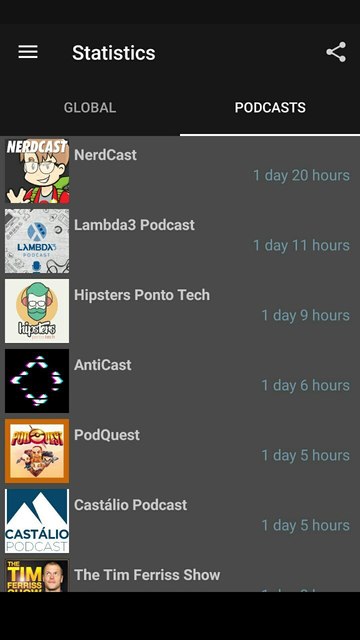
As usual, here is the list of Podcasts and their times:
Just remember that this is an “all-time list”, and I’m tracking time instead of the episode which makes short podcasts not to appear as “most listened” ones. I listen to CBN podcasts almost every day, but they are just some minutes long.
Hours working
Here is the data from my time tracking software, Toggl comparing the last month (first) and this month (second):
There’s an unusual pattern in this chart. Again, before and after my vacation I had long working hours (almost 10 hours).
I had 16 working days this month, and I worked for 139 hours, which mean that I worked 11 hours more than I should (it was 13 in the last month 🎉).
I should probably schedule to work for 7:30 so I would work 8 hours (Brazilian way). 🙄
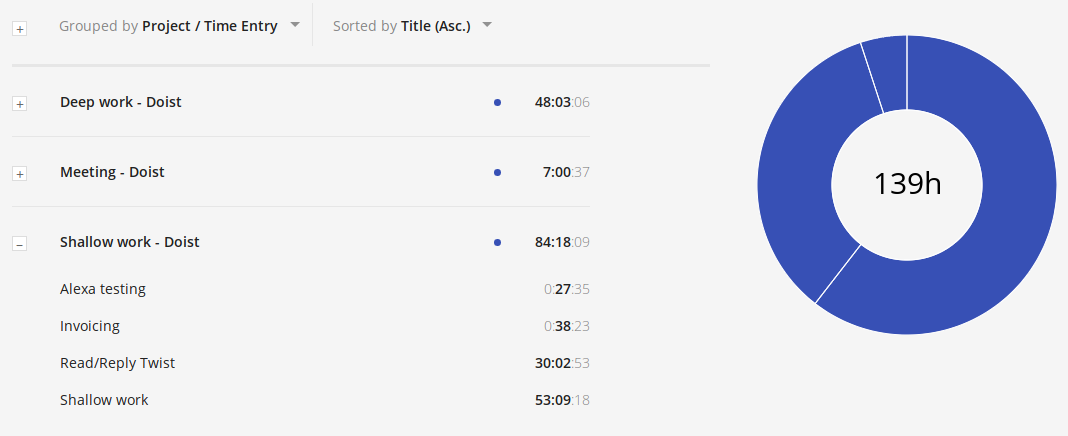
Let’s check Deep work versus Shallow work:
It’s almost the same proportions I had in January.
What I can take from this chart:
- I had more meetings this month; It’s happening because I’m a mentor to the other member of my team and there are some onboarding tasks.
- Shallow work is still 64%. I said it was less than 50% last month, but I really don’t know where did I get this metric. 🤔
“Read/Reply Twist” is still consuming a lot of time. I changed my workflow to process all Twist threads quickly and add Todoist task for them. I don’t think it’s working as expected yet because these threads always take my attention back to Twist, I have to take the control back. 🙂
The good thing is that it’s entirely up to me to improve the way I deal with this problem. I will work on it. 👍
Now, let’s continue to my personal projects, last month first and this month last:
It’s improving! I had a talk last month and also some freelance work to keep my Ruby/Rails skills up-to-date. 💪
I’m delighted to see that I’m back on track to my personal projects. It took around 6 months to stabilize as I predicted.
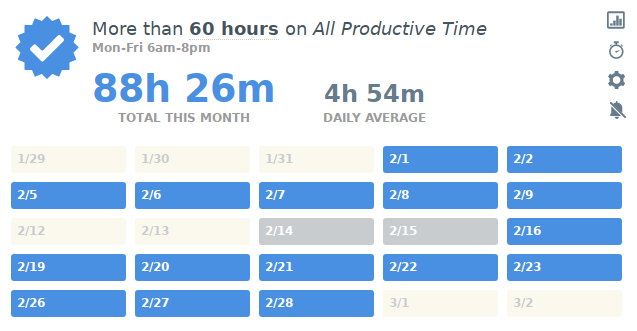
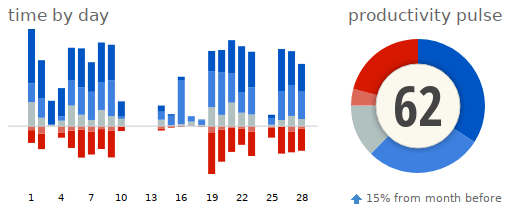
Here is my data from RescueTime:
The report is finally working correctly again. The culprit for my non-productive time is Telegram. I’m keeping it closed most of the day, but it’s still my main communication app.
It looks like I’m spending around 40-50 minutes using Telegram on average:
I’m not tracking my cell phone because I usually don’t use it enough to interfere with my productivity and it was just generating noise to my data. This is why I have almost no activity during vacations.
I was trying to understand if I have a particular moment where I use Telegram the most:
It seems that around 10:00 is the time I most use Telegram. It’s not that good since it should be my peak time. I will have to improve my morning routine. 👍
Physical activity
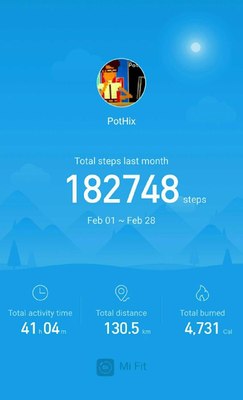
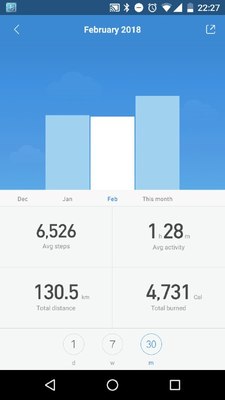
I’m using my Mi band data to calculate my average steps:
The chart shows that it’s almost the same as the last month (6.5k steps), which is not that bad.
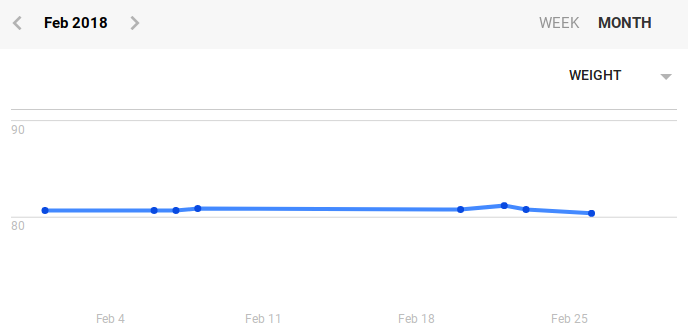
I’m going to the gym almost every day. My goal is to improve my muscles and take care of my left arm after the Bankart and Hill Sachs lesion. As I’m not doing cardio exercises, my weight is still good:
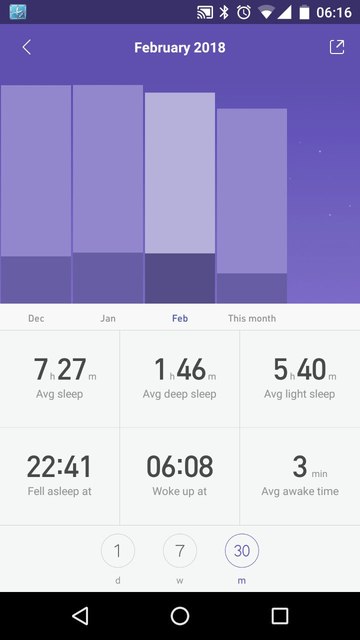
Here is my sleep data for this month:
As we can see in the chart, it’s almost the same as the last month, and I’m happy with that. 👍
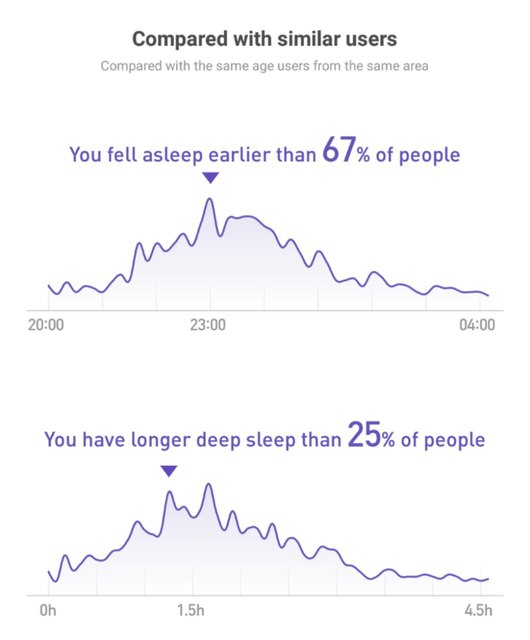
Considering the whole user base from mi-band:
This chart only considers the last 7 days. My goal previous month was to improve my “Fell asleep score” and it’s really better now.
My new routine considers sleeping at 22:30 and waking up between 6 and 6:30. As you can see, it’s working really well. 😀
We just have to ignore the deep sleep for the last 7 days. ✌️
TV Shows
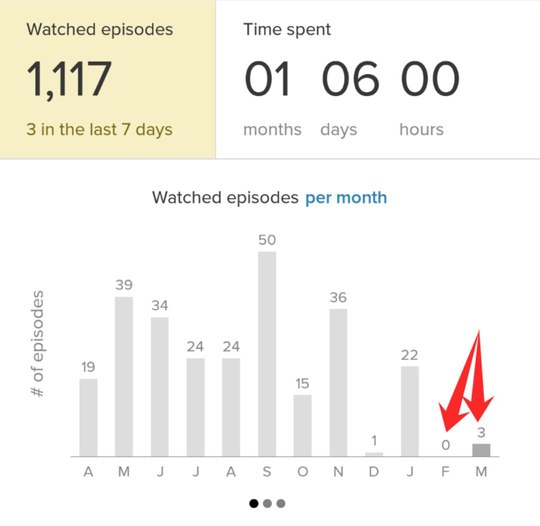
According to tvshowtime I watched 3 episode this month:
I forgot to add it to the app before it was too late. These 3 episodes are related to Punisher. 😀
I spent 3 hours of my life watching TV shows this month… But I also watched some movies. I’m not tracking films yet because I usually don’t watch that much. Last year I watched less than 10 movies. In case I decide to start watching more movies I will consider tracking them.
Words written and errors
I’m using Grammarly to improve my English and track the number of words and errors when I’m writing. Unfortunately, they only send weekly emails, but I will try to keep this metric for a while.
Here are my stats for this month:
- 72766 words written (71248 last month)
- 3451 corrections made (2039 last month)
- 14352 unique words (12320 last month)
The corrections made keep increasing, I’m sure this is happening because of Grammarly premium. It offers some “advanced” corrections.
Locations
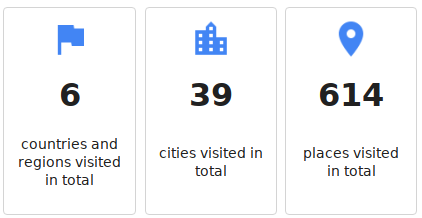
Let’s explore my locations. Last month first and this month right after it:
Just visited some places more but no new cities or countries. 😞
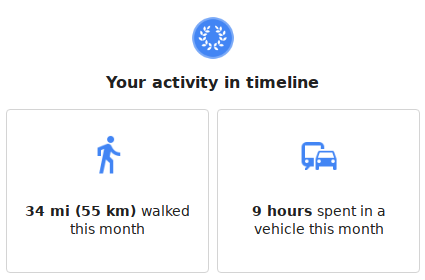
Let’s see the time commuting, last month first and this month second:
Long hours spent on vehicles this month. I decided to visit my parents, and it requires at least 12 hours on a bus 😬. My time walking is almost the same.
Expenses
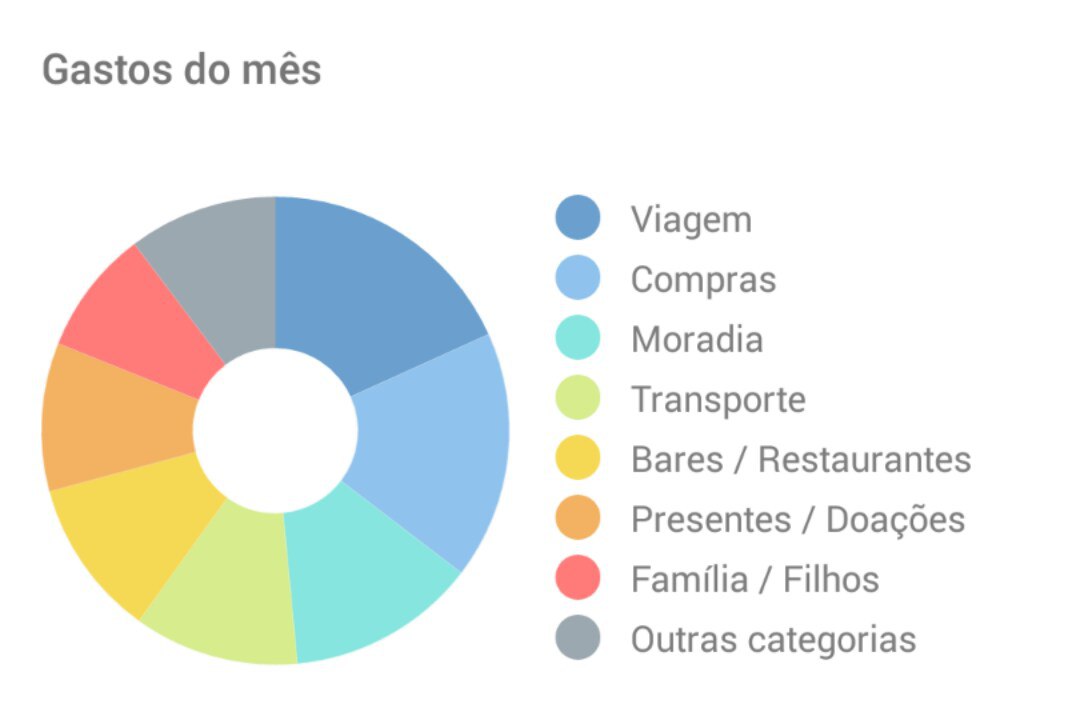
It’s time to check my expenses! 💸
The chart seems to be back to normal. The “Moradia” (kind of a mortgage) section increased because I was not considering it in the previous months.
I’m also not considering the money in transit from my company to my personal account (waiting for money exchange, taxes, accountant, etc.). So, without considering it, my total savings increased by 3.20%! Now I have 87.93% of my goal.
Time to write this blog post
Some people are asking me about how much time it takes to collect all the data and write the blog post, so I decided to add this metric
It took around 4 hours
It actually was 3:21 in my tracking software, but I spent a little bit more than that.
Conclusion
It’s confirmed that I finally have my old routine back. It took almost 10 months to get used to the new job and feel comfortable about my tasks to be able to focus on other things as well. This is a useful metric per se. :)
I have a great trip scheduled for March, and it will probably impact my metrics. Let’s see how it goes! :)
See you next month. 🖖
