4 minutes reading | Também disponível em 🇧🇷
Stats for April, 2017
This was not a good month. I spent most of the time sick, recovering from what may be a Labyrinthitis. I still have to confirm that, but I’m in slow motion for a while.
But anyways, let’s go to the collected data.
Books
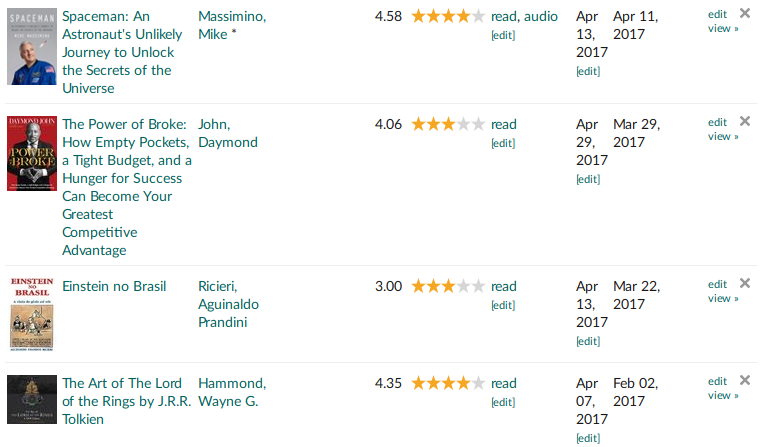
Books for this month:
“Einstein no Brasil” (Einstein in Brazil) is a physical book I borrowed from a friend and The Art of The Lord of the Rings I have in my shelf (as a good LotR fan). The power of broke is an audiobook from the guy of the Shark Tank TV show and Spaceman is a great book from Mike Massimino, the astronaut.
Articles
I’m using the same export file from Pocket and the same script to calculate my articles:
var uls=document.body.getElementsByTagName("ul");
for(var i=0; i<uls.length; i++) {
    console.log(uls[i].children.length)
}

824
596
It means I have 824 articles Unread and 596 articles Read. Comparing with my results from the last month, I got almost 8% more unread and less than 5% more read articles. I have to work on that. :P
Coding
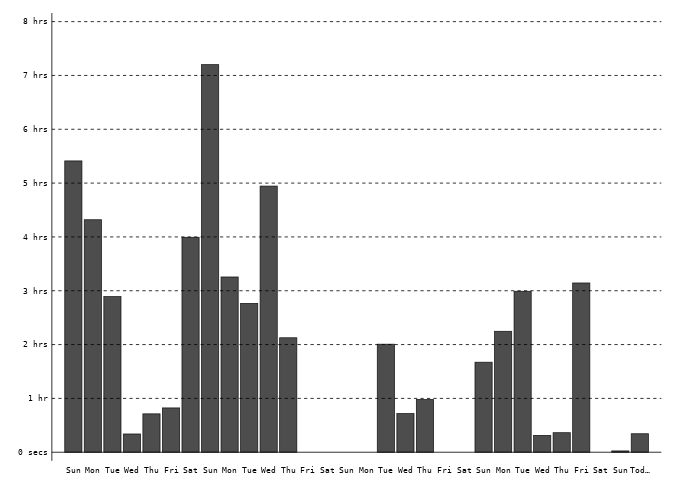
Here goes the charts from Wakatime since the last post.
It was going well at the beginning but then I got sick and my productivity is dropped with it.
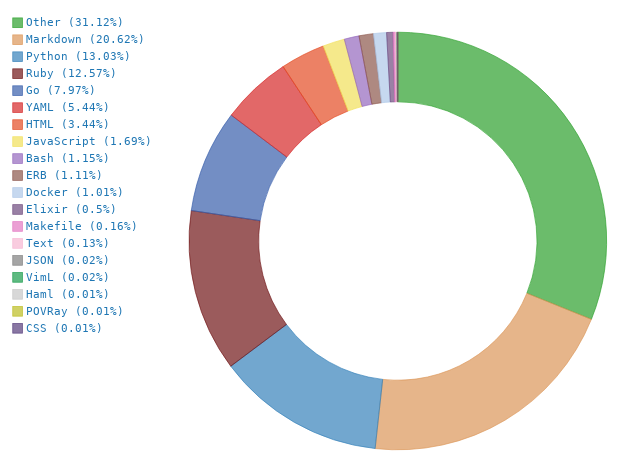
I was playing with Python a little bit, so I had Python, Ruby and Go as the most used languages for this month:
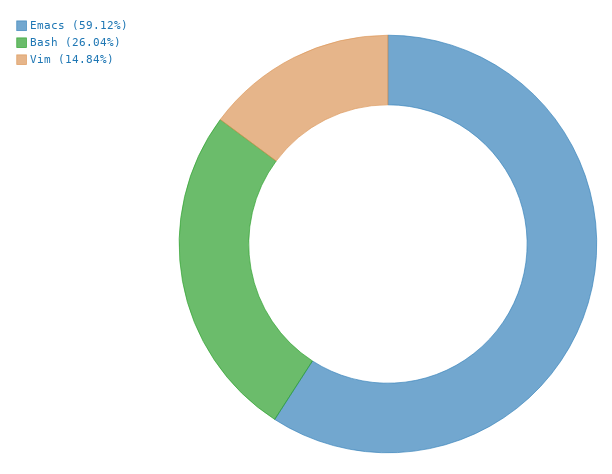
Emacs is my main editor but Vim is still there. I configured my Bash to send reports to Wakatime as well.
Speaking
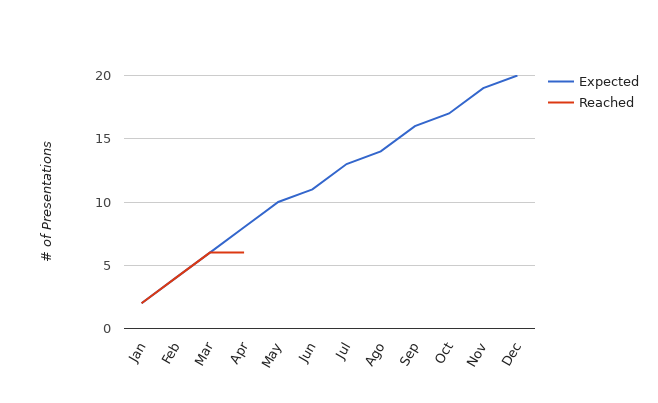
Unfortunately, there was no presentations for this month. My goal for this year is to beat Milhouse best score (19 presentations last year). Here is my burn down chart for this (actually, a burn up [?]):
Podcasts
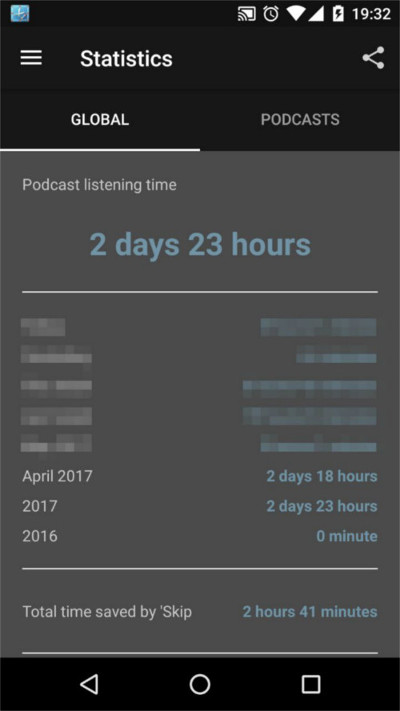
As I said in my last stats post, I’m back to Podcast Addict. This time I decided to buy the application, the developer deserves it. Here is the data:
I removed some data to become easy to see April stats. It was 2 days and 18 hours listening to Podcasts this month.
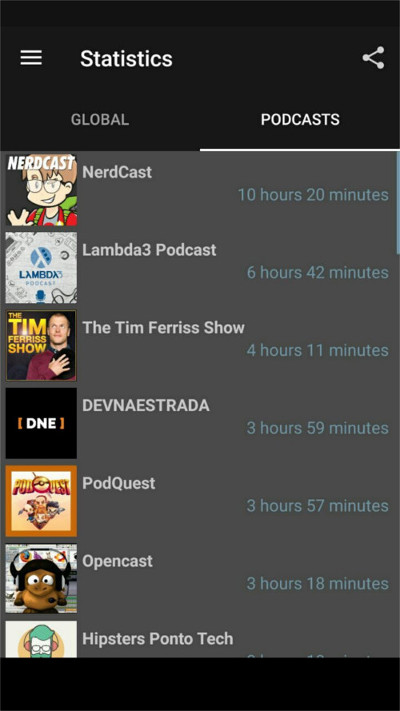
As I’m using Podcast Addict again, I decided to keep a list of the Podcasts and their times as well.
Hours working
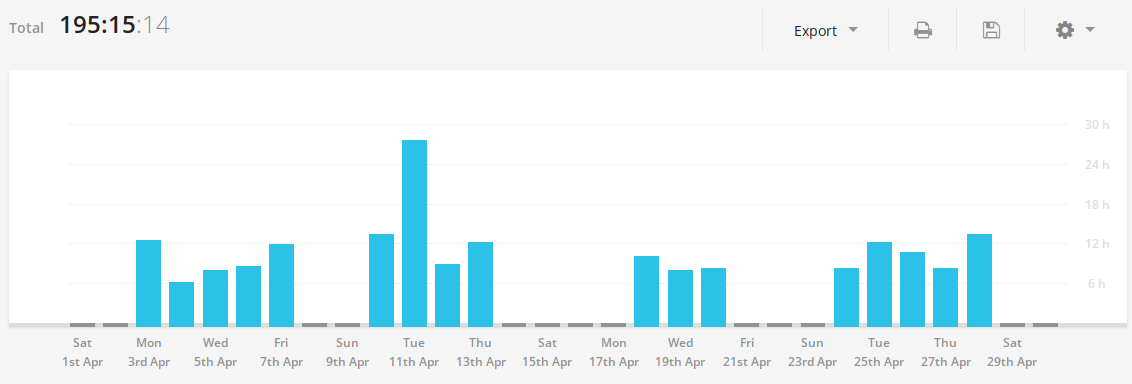
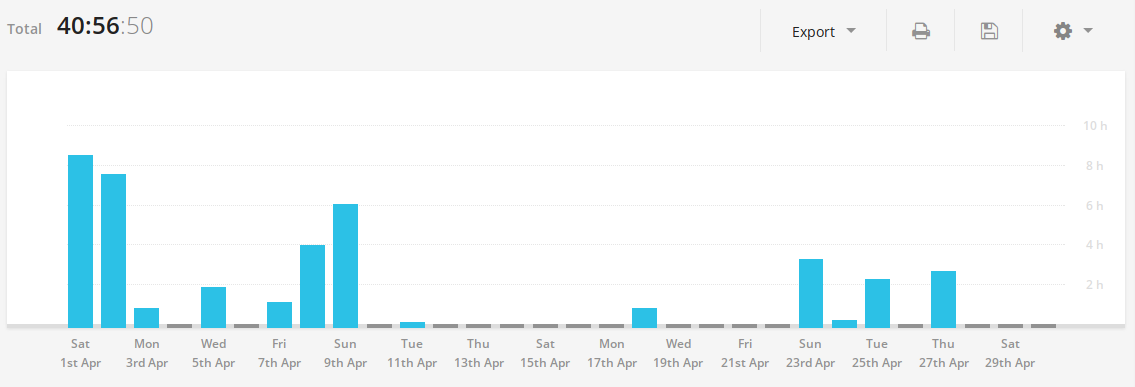
Here is the data from my current time tracking, Toggl:
The above chart is just for my freelance and full-time job. There is another chart for my personal projects:
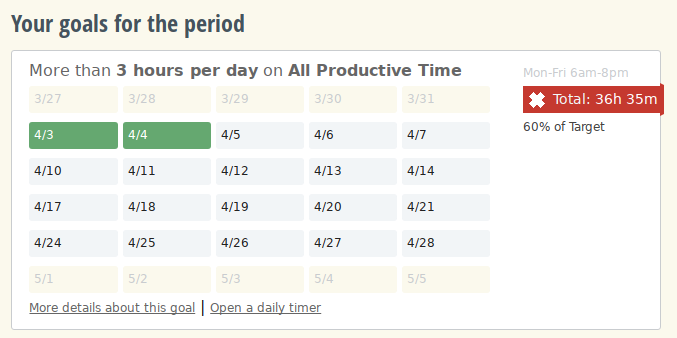
My data from RescueTime is not so good for this month:
But I was expecting something like that already =/
Physical activity
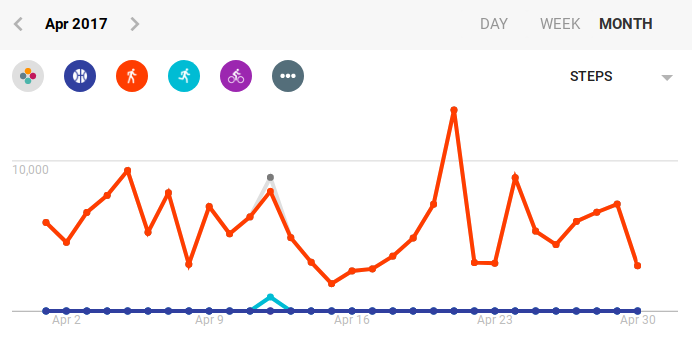
As expected my average of steps a day dropped. Currently it’s around 6k steps.
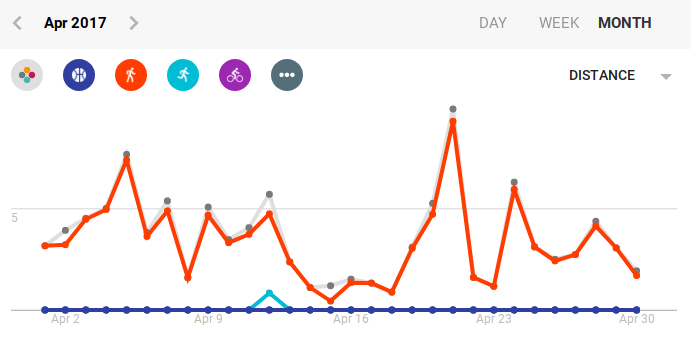
My max distance was 9.3km walking:
My weight is almost the same for the whole month. There is a visible outlier because I was testing a different application and inserted an invalid value. My fault.
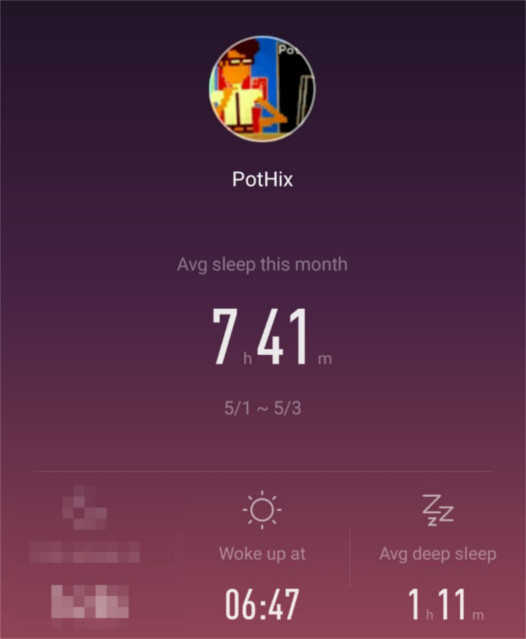
Again, I slept more this month but with less deep sleeping, but just 1 minute less:
TV Shows
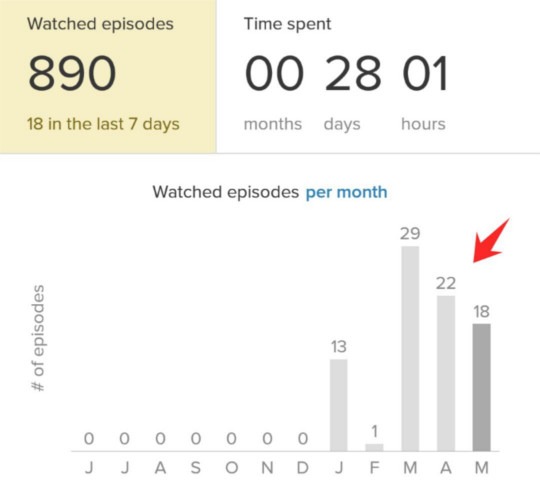
According to tvshowtime I watched 22 episodes this month.
It’s probably a combination of Better call saul, Sense 8, and How I met your mother. As you can see, the first days of May already have a lot of episodes watches, and it’s because of a How I met your mother marathon.
I spent almost 1 day of my life watching TV Series this month.
Locations
This month I visited 13 more places (the last month were 325 places):
Words written and errors
I’m using Grammarly to improve my English and track the amount of words and errors when I’m writting. Unfortunately, they only send weekly emails, so I don’t know if I will keep these metrics because it take some time to build it. Here is an example of the data sent via email:
Anyways, here is the data for this month:
- 37844 words written
- 168 corrections made
- 15160 unique words
Here are my common mistakes:
- 267 Possibly confused preposition
- 100 Missing comma in compound sentence
- 38 Confused preposition
- 6 Comma splice
- 4 Missing comma after introductory phrase
Expenses
My expenses for this month are balanced again:
This chart represent only 15% of net income, the rest is being invested. This month was atypical because I received the money related to my freelance work on January and March. I also received the yearly bonus from my full time job.
This month increased my total savings by 9%! Pretty good! :)
Conclusion
It was not so nice to be sick, as expected. My productivity dropped a little bit and I have to go to the doctor this month and look for it.
Hope to be in a good health next month. :)
