8 minutes reading | Também disponível em 🇧🇷
Stats for May, 2018
It’s May, and it’s time for metrics! 📊
Books
Two books read this month, but both received a 3 stars review:

- Wait, What?: And Life’s Other Essential Questions: Exactly what the author says in the beginning: It’s a lecture that became a book. Not bad, but OK-ish.
- Shop Class as Soulcraft: An Inquiry into the Value of Work: More political views than I was expecting and the pacing is not so good. The motorcycles part resonates with me a lot.
Note: I write a full review for each book I read. You can find them on my Goodreads account.
Articles
I’m experimenting with an integration between Pocket and Google Spreadsheets via IFTTT. The idea is not to use Javascript codes anymore, but it’s still ongoing.
I’m adding a tag to the articles I read and want to include in my list
of articles read for the month. For this month, I’m using the tag
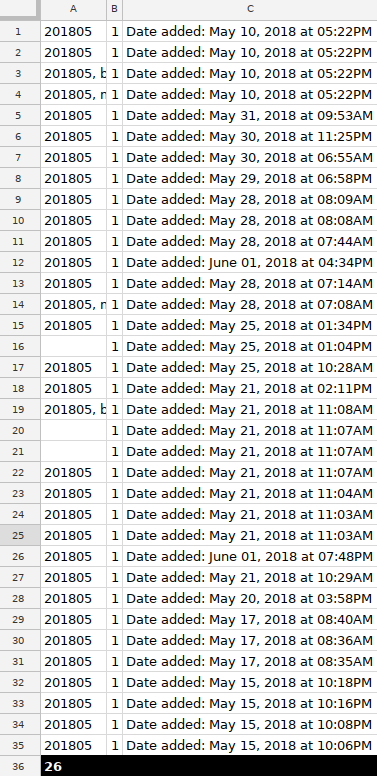
201805:
I use a SUMIF to sum all lines containing the string 201805, and
got 26 articles read.
I did not start at the beginning of the month, and it should be considered just an experiment for now. I hope to soon change to this method of collecting data about the articles read.
Meanwhile, it’s worth keeping the old method:
var pocket = {"unread":1501,"unread_pct":3.66,"read":1096,"read_pct":4.2}

var uls=document.body.getElementsByTagName("ul");
unread = uls[0].children.length;
pocket["unread_pct"] = +((1 - pocket["unread"] / unread) * 100).toFixed(2);
pocket["unread"] = unread;
read = uls[1].children.length;
pocket["read_pct"] = +((1 - pocket["read"] / read) * 100).toFixed(2);
pocket["read"] = uls[1].children.length;
console.log("# Result: " + JSON.stringify(pocket))

# Result: {"unread":1539,"unread_pct":2.47,"read":1146,"read_pct":4.36}
It means I have 1539 articles unread and 1146 articles read. Comparing with my results from the last month (1501 unread and 1096 read), I got around 2.47% more unread articles and 4.36% more read articles.
Still adding more than reading (😕), but I’m still not sure if this is a problem. I may never read all those articles I marked to read later, but does it really matter? 🤔
Coding
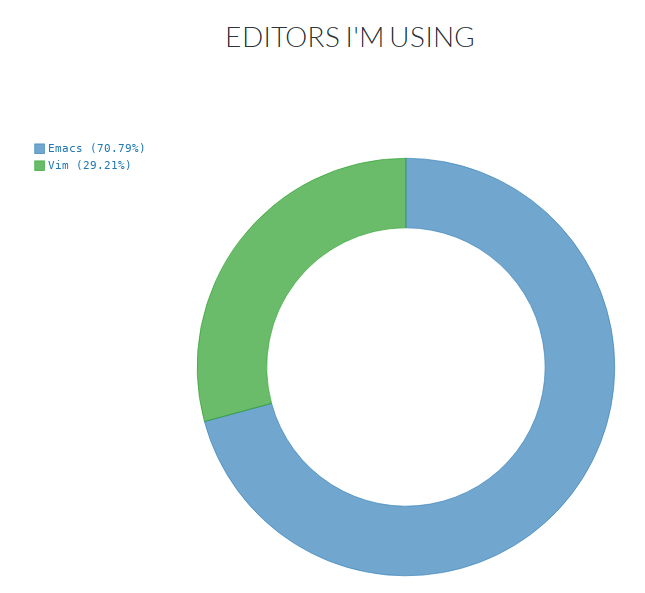
Here are the charts from Wakatime since the last post. I will start with editors this time:
Nothing new here, 70-30 between Vim and Emacs.
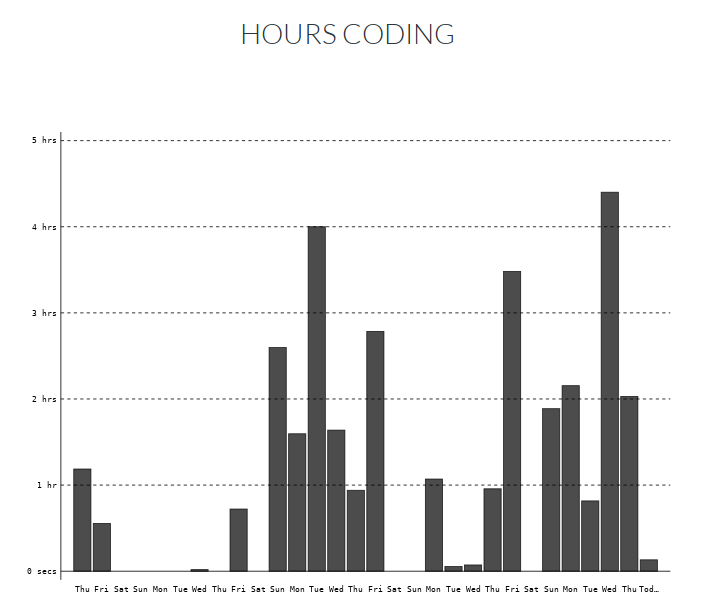
Not that bad.
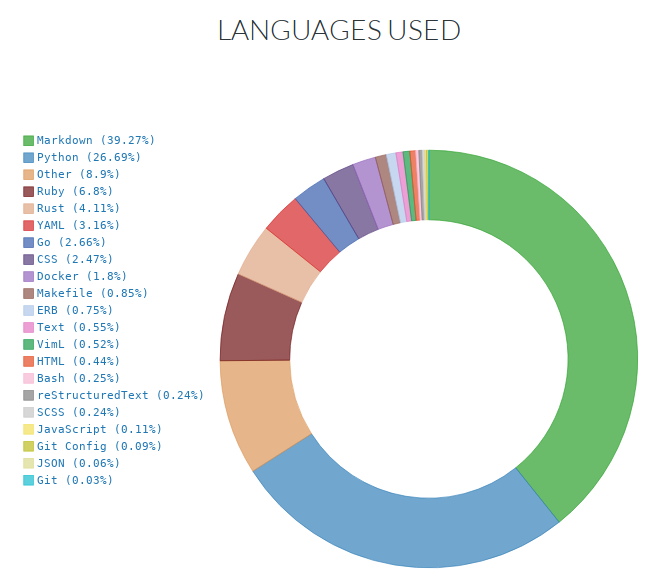
Markdown is back as the first language because of some big posts I had to write using Emacs. Python is the second most used language because of Todoist and Twist, and Ruby is still present there 😉.
This month I had a little bit of Rust and Go, which is nice. I think I will have more Rust next month. 😀
Speaking
No talks this month as well 😕, but one scheduled for the next month. 👍
Completed tasks
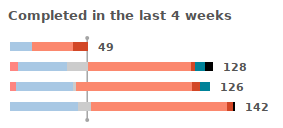
Here is the comparison of the tasks for the last month (first) and the tasks for this month (second). I extracted it from Todoist.
Things are better this month! Hope to remember to take the screenshot before the week cycle ends next month.
Podcasts
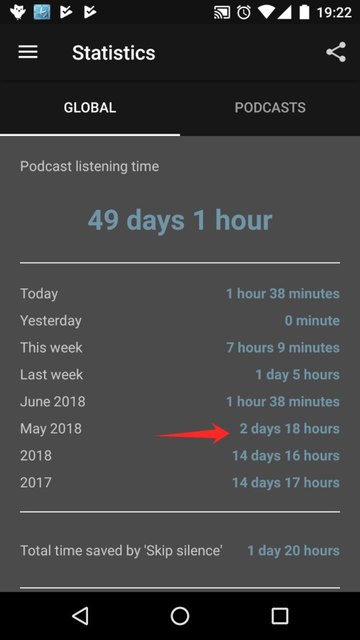
Here is my Podcast Addict stats:
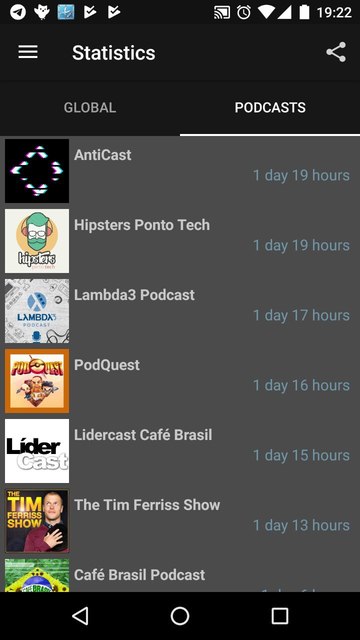
2 days and 18 hours of podcast time. Here is the list of Podcasts and their times:
Unfortunately, this list is based on time. Anticast is not a Podcast
I’m used to listening, but they have some good episodes from time to
time. The problem is that they are quite long (~1h30) while other
shows tend to have episodes of about 30min.
Well, keep in mind that this is an “all-time list”, and I’m tracking time instead of the episode which makes short podcasts not to appear as “most listened” ones. I listen to CBN podcasts almost every day, but they are just some minutes long.
Hours working
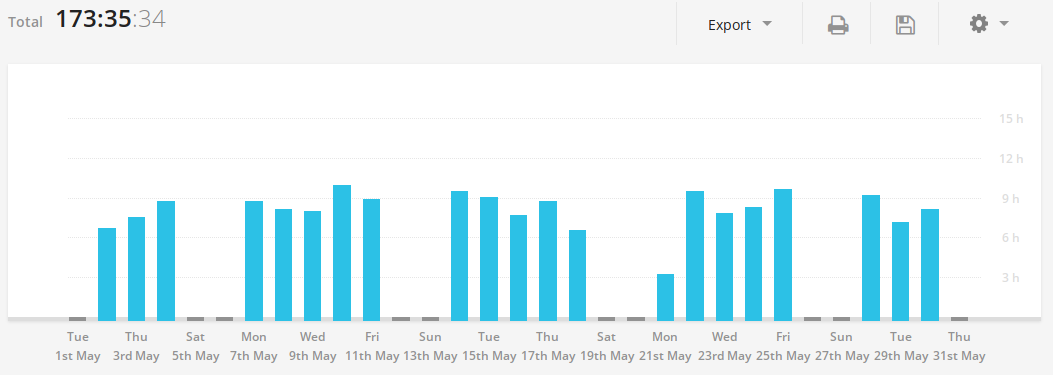
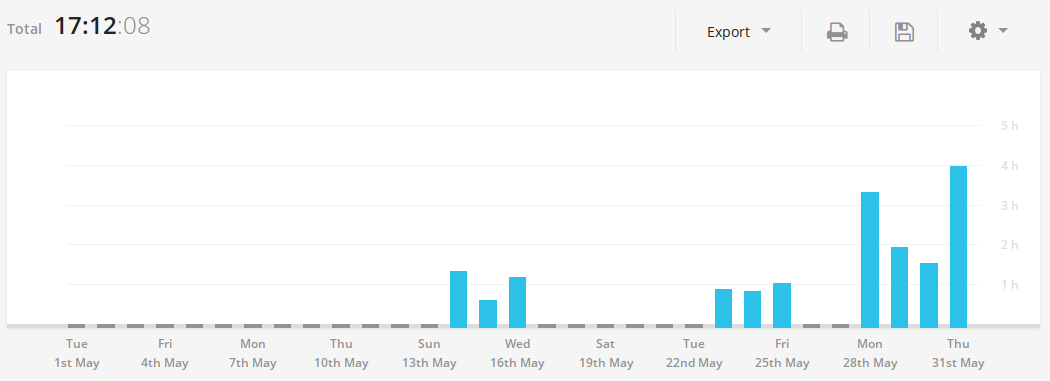
Here is the data from my time tracking software, Toggl comparing the last month (first) and this month (second):
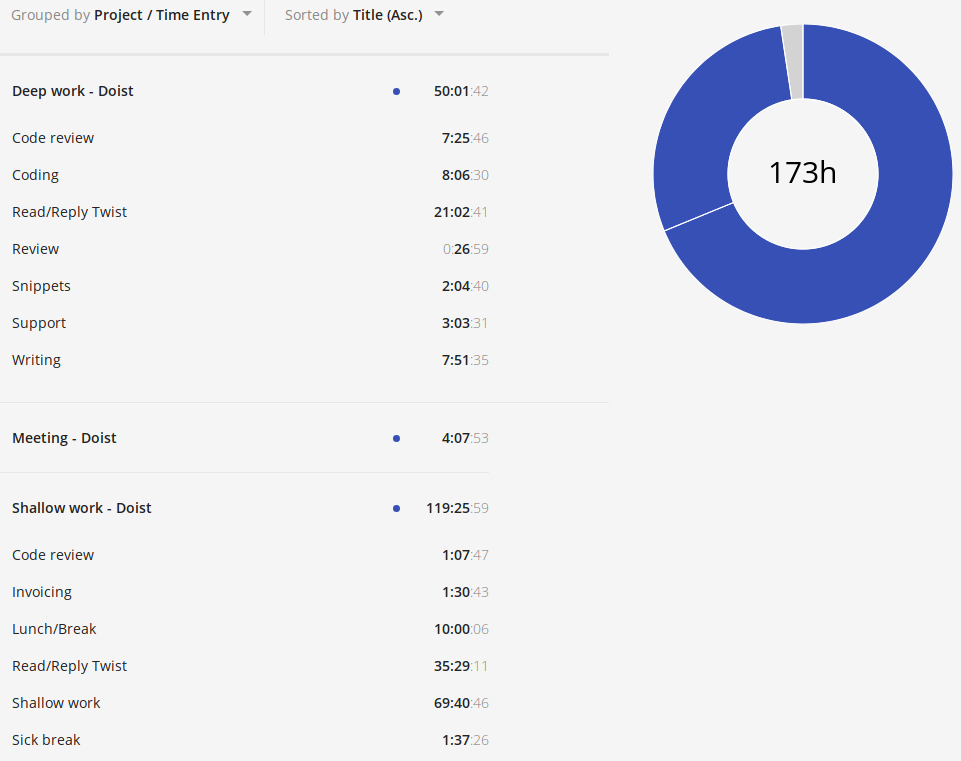
I had 21 work days tracked this month, and I worked for 173 hours, which mean that I worked 5 hours more than I should (the same as I had in April). Not bad but the goal is to reach 8 hours and remove those bars that exceed the 9h threshold.
Let’s check Deep work versus Shallow work:
I decided to track my lunch/break time, so I can understand how much time I’m spending on tasks that are not related to work at all (reading emails, talking to people via Telegram, etc.). Unfortunately, I started this too late. I have only 10 hours of lunch break so we will have to skip it to the next month.
I have to be more descriptive with Deep work. I’m trying to keep Writing and Read/Reply Twist as the same thing, maybe it will be better next month. I’m also stunned by the small number tracked as deep work coding. This month I spent far more time discussing and writing things down than actually coding. 😕
For shallow work, we have:
- Meeting time is stable (and productive), considering two 1-1 meetings (1 hour each) and four weekly meetings (around 40 minutes each)
- Read/Reply Twist is still consuming a lot of time, more than 2 hours every day.
- Lunch/Break is still work in progress
Now that I’m looking into all the data, I found it interesting that 1/3 of my time is spent communicating. 🤔
Let’s check the Twist usage by hour (previous month first, this month after):
I’m not that satisfied with this chart. The perfect chart for me would have a small peak at 9-10, almost no usage between 10-13, a giant peak between 14 and 16 and less usage from 16 to 21. I should have no usage after 21.
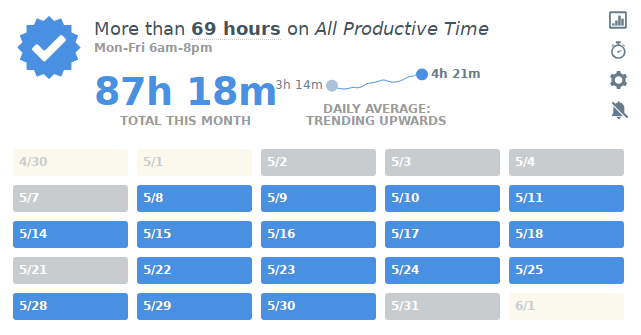
The usage I described above is precisely the opposite of what is my productive time. I used the daily when tracker and found the times I’m more alert and energetic. As usual, I should post about it as well but never do. 😕
Now, let’s continue to my personal projects, last month first and this month last:
It’s definitely better! We should consider the holiday for this month, though. 😛
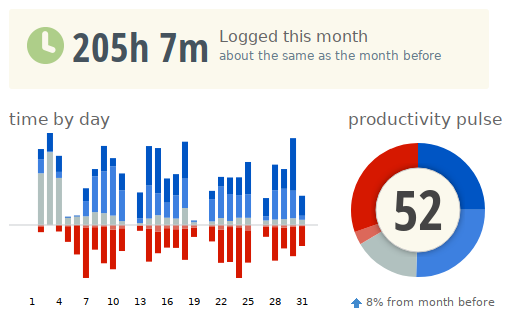
Here is my data from RescueTime:
My productivity pulse is better this month. Last month I did some research on what happened and found that Magic the Gathering was taking a lot of my time and also adding some outliers, it seems to be better now.
I’m still following my Telegram usage, here is the comparison from the previous month to the current one:
It seems to be better but not much. I have an alert of my time spent using Telegram, but when it fires, it’s usually too late. Working on it.
Comparing Telegram usage by time of the day, we have (last month first, this month second):
It improved a little bit during my peak times. I will consider that as an improvement and keep working on it.
Physical activity
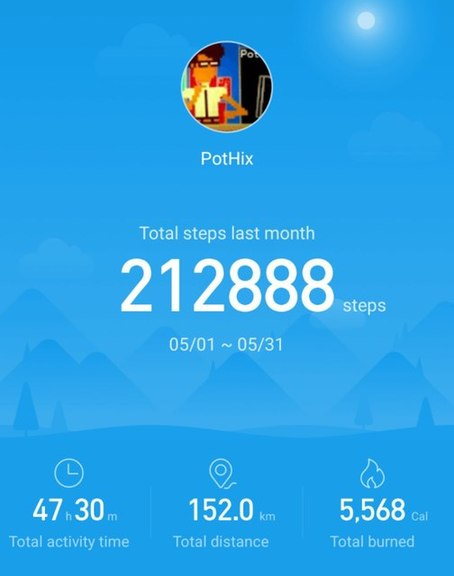
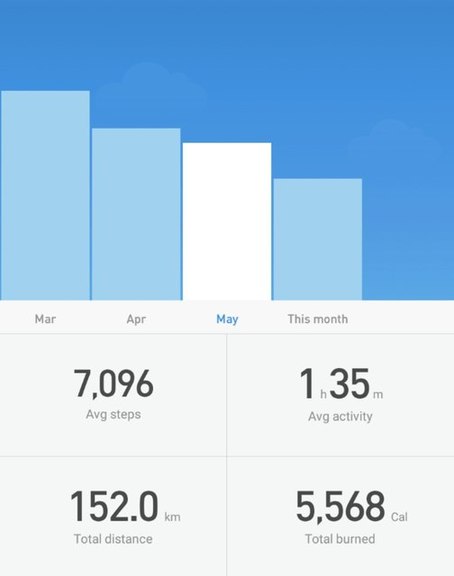
I’m using my Mi band data to calculate my average steps:
This month I have 7k steps compared to 8k from the previous month.
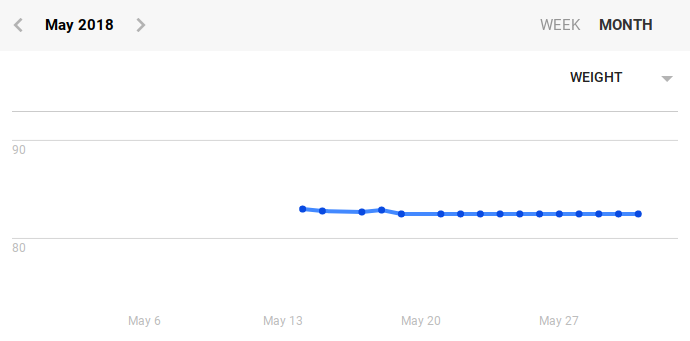
I’m back to the gym, but my weight is still the same. I hope to have a big improvement next month:
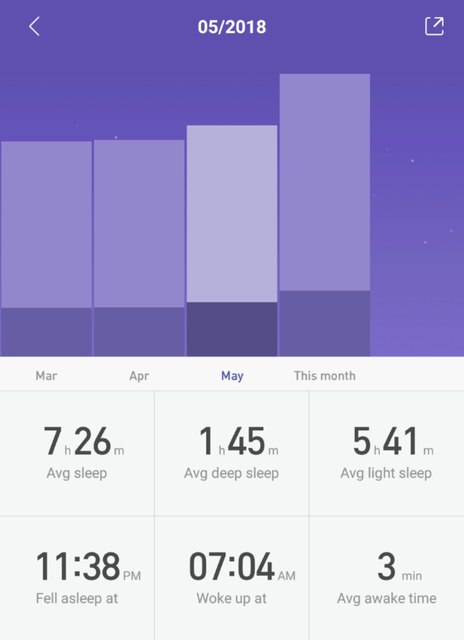
Here is my sleep data for this month:
Better sleeping! That’s good news! 🙃
TV Shows
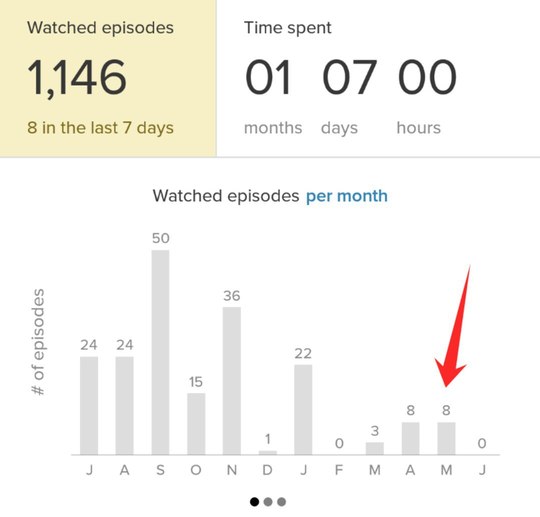
According to tvshowtime I watched 8 episode this month:
These episodes are related to the new season of 13 reasons why and The End of the F***ing world.
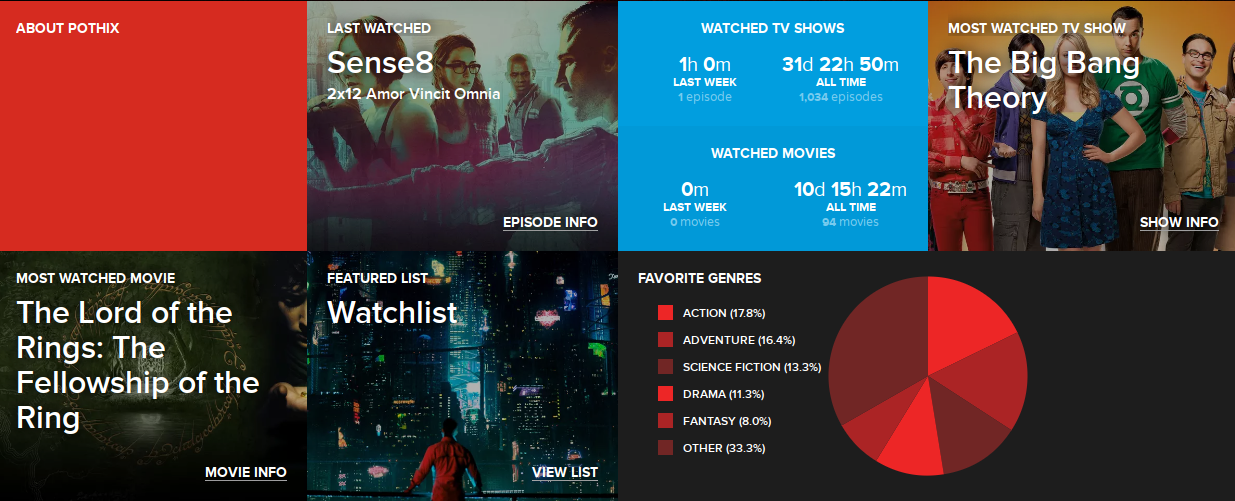
I mentioned that I’m trying trakt.tv, and I’m still getting used to it. This is what I’m going to use:
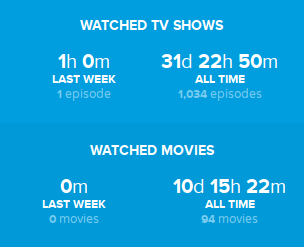
As you can see, I can also track movies. The only data that matters is the following:
I know I’m still missing some movies and TV shows there, hope to add them as soon as I remember.
Words written and errors
I’m using Grammarly to improve my English and track the number of words and errors when I’m writing. Unfortunately, they only send weekly emails, but I will try to keep this metric for a while.
Here are my stats for this month:
- 38747 words written (61385 last month)
- 385 corrections made (934 last month)
- 11213 unique words (16473 last month)
Grammarly is not working good inside Twist anymore, I don’t know why. I will have to reach out to Grammarly again soon.
Locations
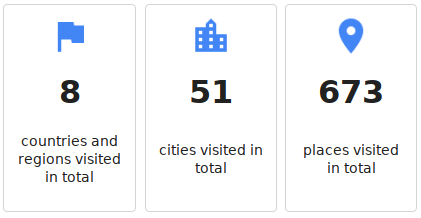
I’ve added some places to the list:
Other than that, no new cities or countries. 😞
Let’s compare the previous and this month, the previous first and this month right after it:
One new city popped out, but I have no idea which one it is. Maybe it is the lost city from the last report. 🤷♂
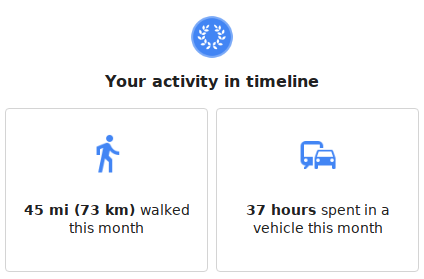
My time commuting improved a lot this month:
Still many kilometers to “reach the moon”:
Expenses
It’s time to check my expenses! 💰
This month I spend 32% of my earnings, which is still below my expectations (40%). This 32 % are distributed into the following categories (in pt-BR):
We spent more with Mercado (groceries) than expected (last month it was just 3%), hope to adjust it for the next month.
As usual, I’m not considering the money in transit from my company to my personal account (waiting for money exchange, taxes, accountant payment, etc.). So, without considering it, my total savings increased by 0.06%. This is a good number given the current scenario of the Brazilian economy (it’s positive because I added money, or it would be negative), and now I have 94.11% of my goal.
Time to write this blog post
It’s an important metric to understand if it worth taking the time to write it. So:
It took 5 hours and 12 minutes to write it
It’s much more than I expected, but I think it’s happening because I was researching different services and also doing some research on how to conduct my investments. Hope to decrease this time next month.
Conclusion
It took a lot of time to write this post, and this is bad, but other than that, the month was good in general. All my goals for this month were met, so I have nothing to complain. ✌
See you next month. 🖖
