5 minutes reading | Também disponível em 🇧🇷
Stats for May, 2017
Here we go again for my stats for the last month. :)
Books
I will start a in a new company this month, so I decided to re-read Deep Work (I really recommend this one). This book is just great for everyone who wants to focus and do the hard work. It has everything to do with my new work schedule. The book about Elon Musk was a good reading as well, this guy has some great ideas.
Articles
I’m using the same export file from Pocket and the same script to calculate the amount of articles I read:
var uls=document.body.getElementsByTagName("ul");
for(var i=0; i<uls.length; i++) {
    console.log(uls[i].children.length)
}
861
662
It means I have 861 articles Unread and 662 articles Read. Comparing with my results from the last month, I got almost 5% more unread articles, but this time I got almost 10% more read articles (double of the last month’s). It happened because I took some hours to read the some articles of my Pocket account.
Coding
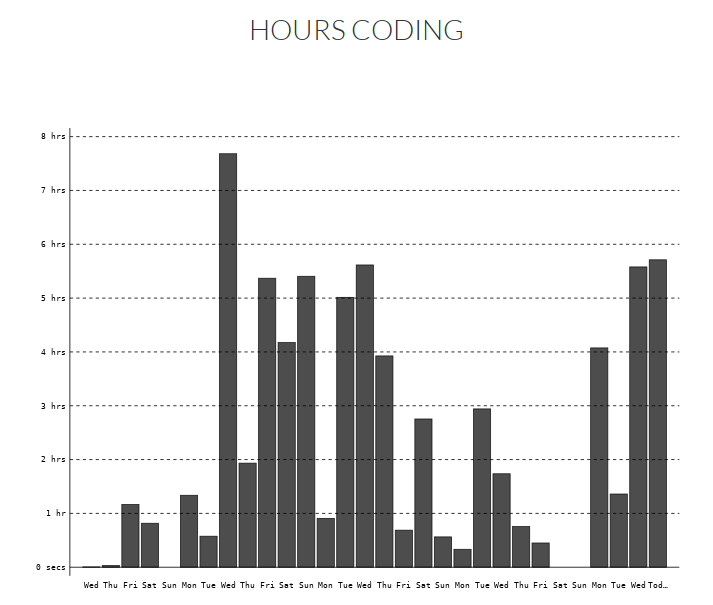
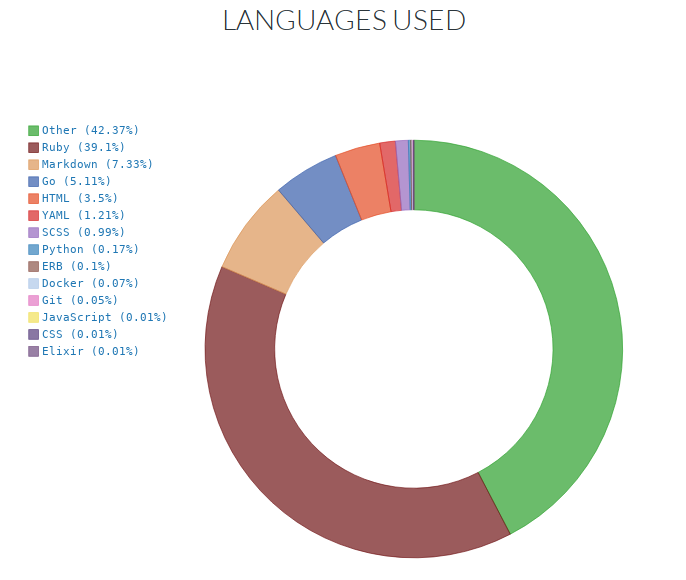
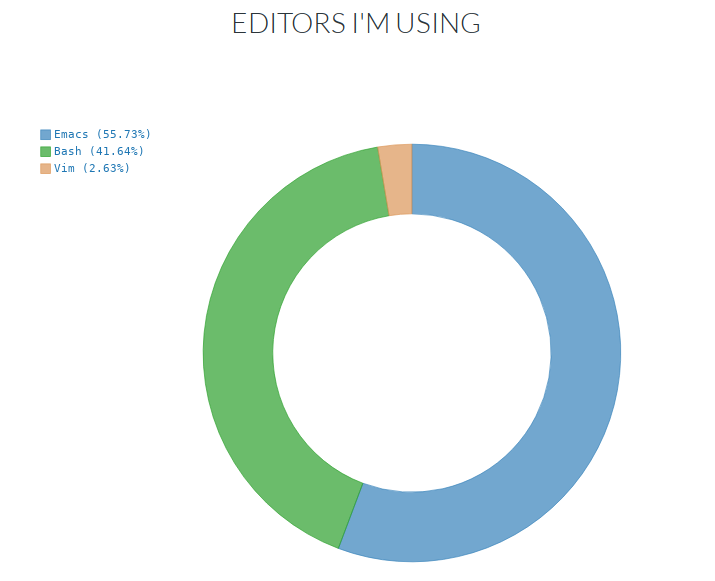
Here goes the charts from Wakatime since the last post.
The chart for this month is really better than last month’s but still less than what I was expecting.
Back to Ruby this month, there were some old Rails projects to work. But most of my time was spent on the Terminal, for a change.
Emacs is my main editor and there was almost no Vim this month. But Bash is taking more than 40% of my time.
Speaking
- Apache Mesos as a tool at TDC Florianópolis.
- A ruby application end to end at TDC Florianópolis.
- Tech-talk at Locaweb. It was a Tech-talk about TDC Florianópolis. As usual, every time I go to a conference I schedule a talk to explore the content I saw there. This was no different. :)
- Deconstructing the web at BioRitmo tech-talks.
Here is my current status of presentations this month:
I’m on-track again! :)
Podcasts
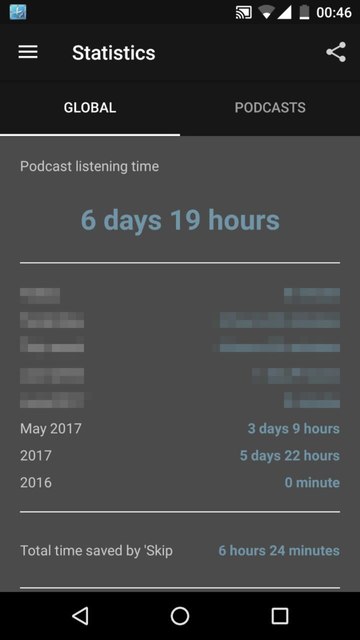
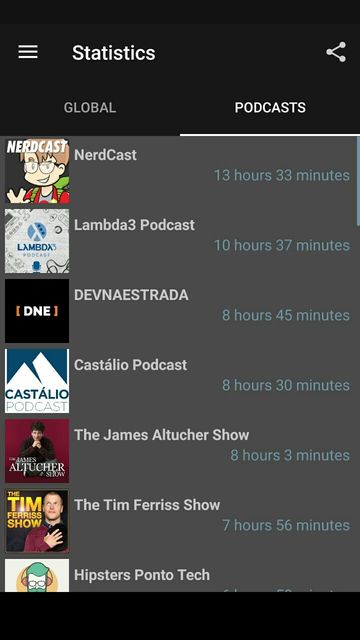
Here is my Podcast Addict stats:
It was the equivalent to 3 days and 9 hours of podcast time (I tend to speed up all my podcasts, so I don’t know how much time it took for real). It’s almost 15 hours more than April.
I decided to keep a list of the Podcasts and their times as well.
Just for the record, this is an “all time list”. :)
Hours working
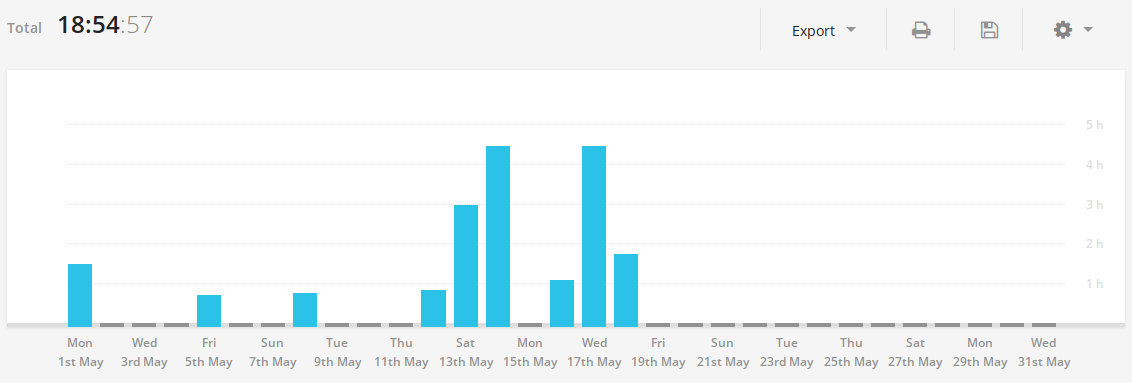
Here is the data from my time tracking software, Toggl:
The above chart is just for my freelance and full-time job. There is another chart for my personal projects:
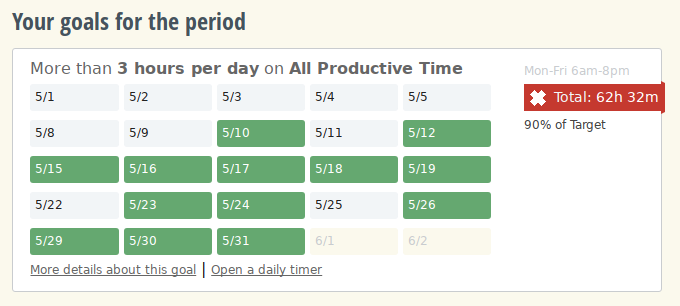
My data from RescueTime is better than last month but not good enough yet:
Maybe next month I will reach the target.
Physical activity
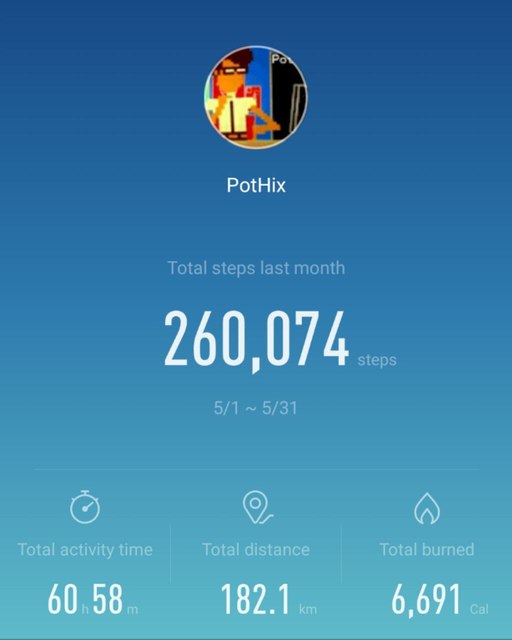
I’m using my Mi band data to calculate my average steps:
According to this data, I can conclude that I had a daily average of 8.3k steps (260/31).
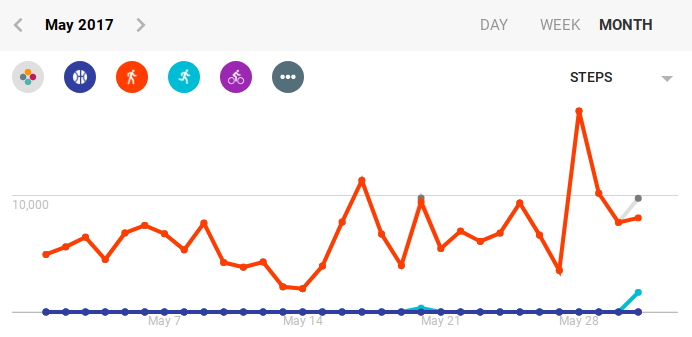
And these are my steps each day:
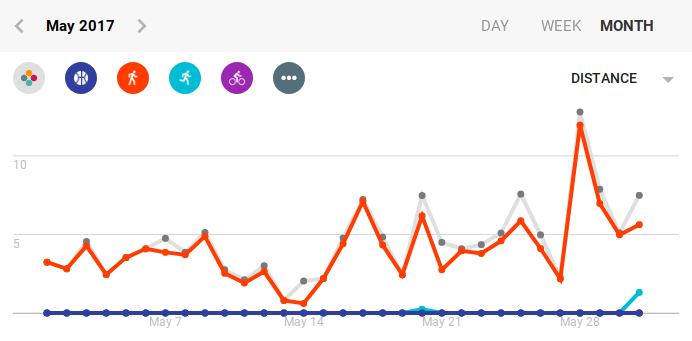
The peak was in a nice Sunday when I met some friends to chit-chat in a local park. It was just 3 of us talking and walking around the park.
My max distance was 12.7km walking in that same Sunday:
I lost some kg this month. This is a good sign, I think.
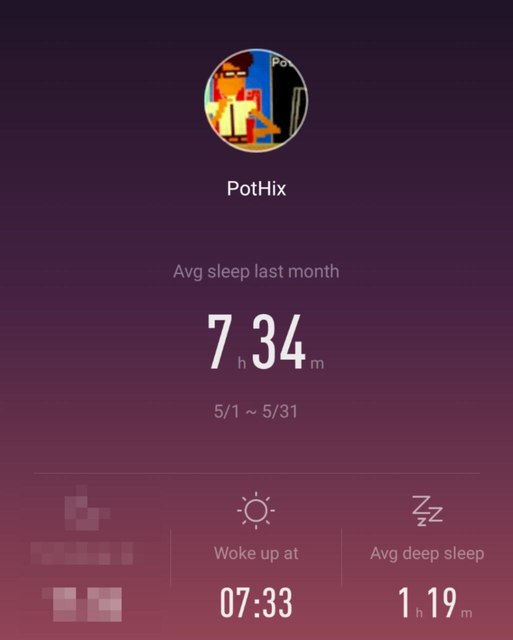
This month I slept less but with more deep sleep:
I think this is a good sign as well. I want to sleep better, not sleep more.
TV Shows
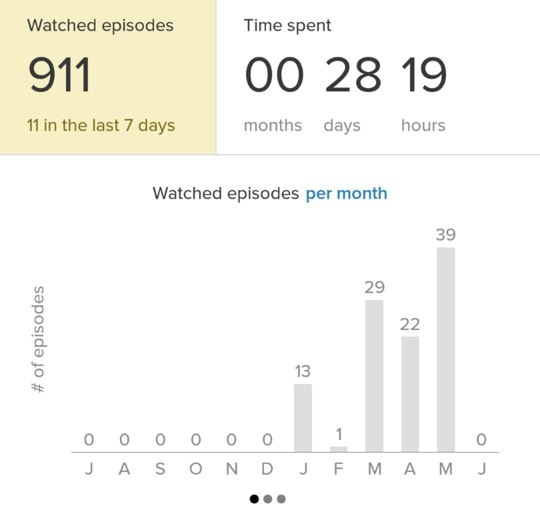
According to tvshowtime I watched 39 episodes this month.
More than 18 of them is still part of our (my wife and me) How I met your mother marathon. The other episodes are a combination of Better call saul, 13 reasons why, and Sense 8.
I spent almost 1 day of my life watching TV Series this month.
Words written and errors
I’m using Grammarly to improve my English and track the amount of words and errors when I’m writting. Unfortunately, they only send weekly emails, I don’t know if I will keep these metrics because it take some time to build it.
Anyways, here is the data for this month:
- 26914 words written
- 243 corrections made
- 11478 unique words
I decided to remove my “common mistakes” from this report because the data seems to be not reliable.
Locations
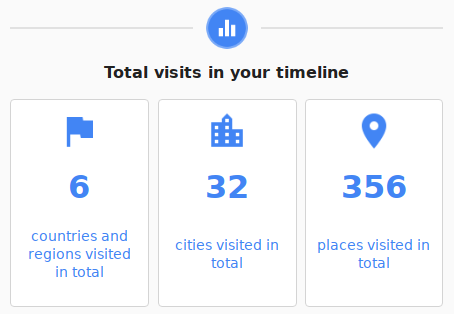
This month I visited 18 new places (the last month were 338 places) and 1 new city:
Expenses
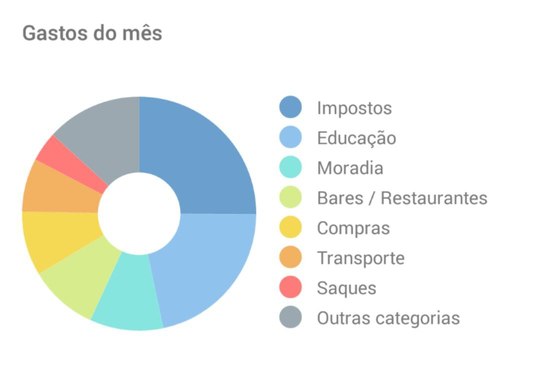
My expenses for this month:
This chart represent only 47% of net income, the rest is being invested. Just like last month, this was atypical as well. Last month I received the money related to my freelance work on January and March and now I had to pay the taxes related to it.
This month increased my total savings by 1%. I have 68.83% of my goal.
Time to write this blog post
Some people are asking me about how much time it take to collect all the data and write the blog post, so I decided to add this metric.
I’m spending almost no time to collect the data, most part of it is automatic. The services that require manual interaction are already part of my day-to-day life, so I’m not tracking it.
It took 2 hours and 30 minutes to write this post
Conclusion
This month was better than the last one. It was not so good as I expected because I had to do some exams to be sure I’m OK and I was also changing jobs. I was working for the same company for the last 7 years and decide to try something else, but this is a subject for a different post. ;)
I got two weeks to “relax” (cof… work on some personal projects… cof), so I don’t know exactly how the next month will be. Let’s wait for the next post! :)

