3 minutes reading | Também disponível em 🇧🇷
Stats for March, 2017
Back to work this month. :)
After one month vacation, I got back to my routine and got some good results this month.
Books
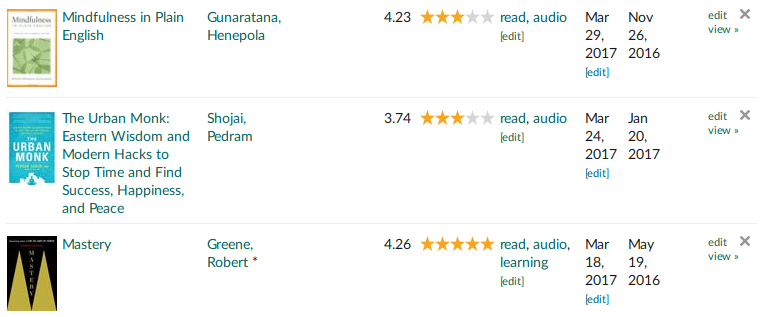
Added three more books to the list:
I have to note here that Mastery is one of the best books I ever read. Both Mindfulness in plain English and The Urban Monk are about meditation and how to live a minimalist life.
Articles
I’m still trying to find a way to track the articles I read. In the past months I’ve being adding all of them to Pocket and reading there. Unfortunately I could not find anything to build information from my pocket reading data (suggestions welcome).
For now I’m just exporting my content in HTML format and using a simple Javascript to count it:
var uls=document.body.getElementsByTagName("ul");
for(var i=0; i<uls.length; i++) {
    console.log(uls[i].children.length)
}

760
570
It means I have 760 articles Unread and 570 articles Read. Let’s see how it will be next month. ;)
Coding
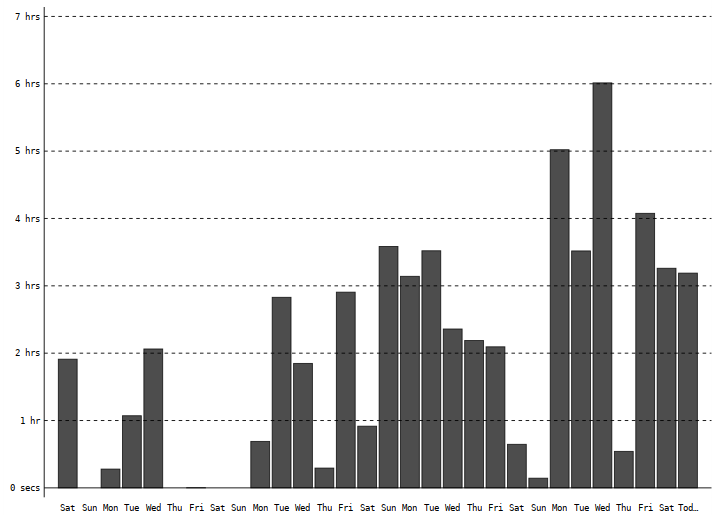
I’ve changed the charts from Wakatime since the last post. Let’s check the new ones:
There is no colors or day numbers anymore but it looks better to understand how many hours I’ve been working through the month. It’s still less than what I was expecting, but that’s the main idea, time to improve!
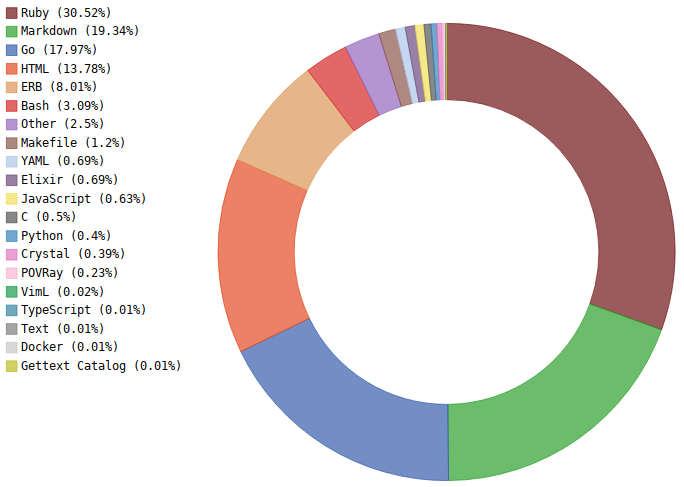
Ruby and Go are the most used languages for this month:
Markdown is just my posts here. LOL
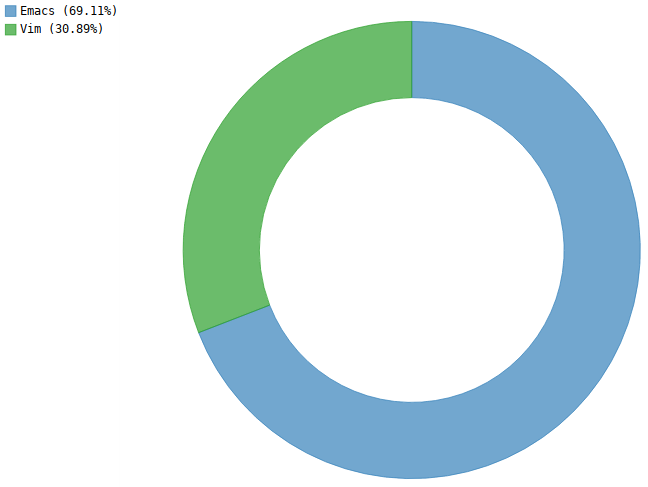
I’m shifting from Vim to Emacs, but I still use Vim a lot:
Speaking
Presentations for this month:
- Tech-talk at Locaweb. It was a Tech-talk about FOSDEM. Every time I go to a conference I schedule a talk to explore the content I saw there. I consider that a good practice with my coworkers.
- Gaveteiro it was the same presentation that inspired my book but with a small audience. It took 1h 52min and was pretty cool (at least for me). :)
Podcasts
Back to Podcasts again! This time I decided to try a different Podcast player after many years using Podcast Addict. I bought Pocketcasts and I used it for the whole month.
Don’t worry about the “Since 29th of January” because I did not used any podcast player in February. ;)
I really don’t know what these numbers mean. But 1 day of podcast listening make sense for me. I usually listen podcasts 3x faster, this is what causes the confusion. :P
I will probably get back to Podcast Addict in April, because it’s superior in many features. Maybe I will write about it soon.
Hours working
My time tracking with Toggl is more mature now.
Besides the 206h30min I have 6h30min working on my personal projects.
RescueTime says I reached my goal for the month:
That’s great. :)
Physical activity
Back to the old rhythm, around 10k steps:
My max distance was 11.5km walking:
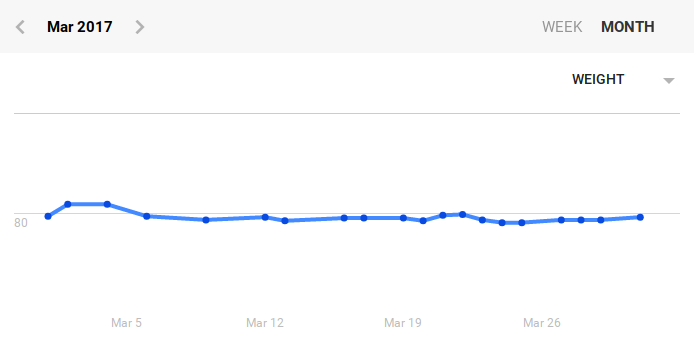
My weight is not there yet, but I’m still tracking:
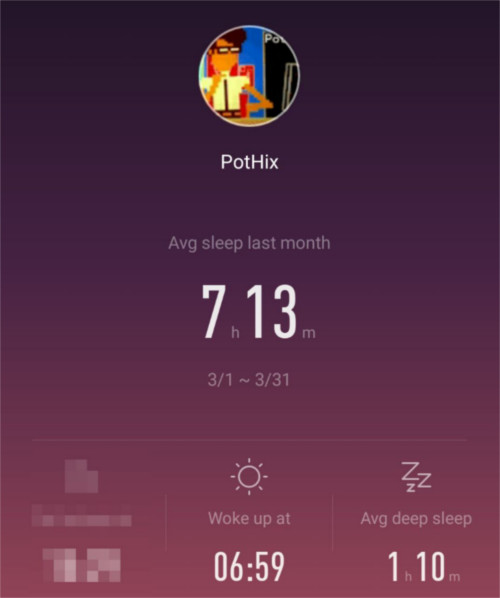
I slept more this month but with less deep sleeping:
TV Shows
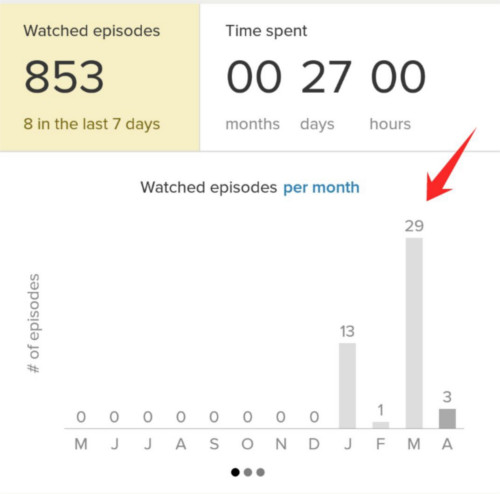
According to tvshowtime I watched 29 episodes this month.
It’s probably a combination of Vikings, Luke Cage and Iron Fist.
Locations
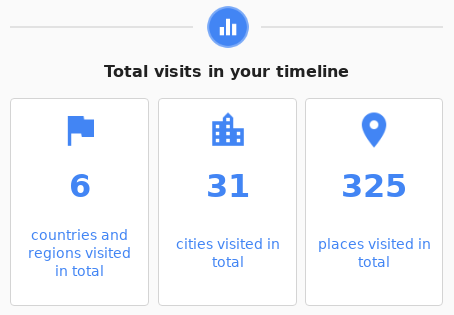
This month was not so exciting like the last one, but I worked on my Google Timeline data to make it more accurate. Some cities were removed but I have identified more places I visited:
Expenses
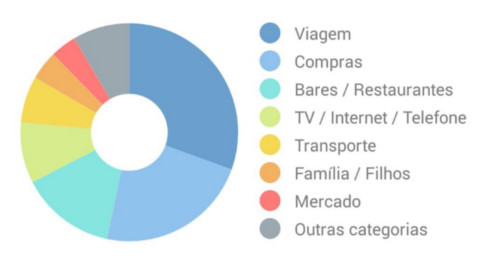
Phew… finally my expenses are getting back to normal, no more travel taking 50%+ of it. But it’s still taking 25%+. :P
This chart of expenses represent 46% of net income, the rest is being invested.
Conclusion
It’s good to be back and see my productivity data growing. I still want to improve my expenses because it’s not as I expect it to be. Maybe next month. :)
