8 minutes reading | Também disponível em 🇧🇷
Stats for Apr, 2018
It’s time for April metrics! 📊
Books
Note: I write a review for each book I read. You can find them on my Goodreads account.
Again, just one book this month, and again, a 5 stars one!
A Guide to the Good Life: The Ancient Art of Stoic Joy. This book was on my reading list for many months now. After reading it, I realized I’m practicing a fraction of Stoicism for many years. Here is my review if you want to read my thoughts on it.
Articles
As usual, I’m using that same export file from Pocket and a script that look like the one I used last month. Here is the script with the actual data:
var pocket = {"unread":1446,"unread_pct":1.8,"read":1050,"read_pct":2.86}

var uls=document.body.getElementsByTagName("ul");
unread = uls[0].children.length;
pocket["unread_pct"] = +((1 - pocket["unread"] / unread) * 100).toFixed(2);
pocket["unread"] = unread;
read = uls[1].children.length;
pocket["read_pct"] = +((1 - pocket["read"] / read) * 100).toFixed(2);
pocket["read"] = uls[1].children.length;
console.log("# Result: " + JSON.stringify(pocket))

# Result: {"unread":1501,"unread_pct":3.66,"read":1096,"read_pct":4.2}
It means I have 1501 articles unread and 1096 articles read. Comparing with my results from the last month (1446 unread and 1050 read), I got around 3.6% more unread articles and 4.2% more read articles.
Well, I’m reading more than adding, but I don’t know if I’m happy with this situation. It’s been some months since I’m complaining about my read it later but it doesn’t seem like a big problem.
I’m experimenting with an integration between Pocket + Google Sheets via IFTTT. The idea is to count the number of articles read and maybe we will have something new next month.
Coding
Here are the charts from Wakatime since the last post. I will start with editors this time:
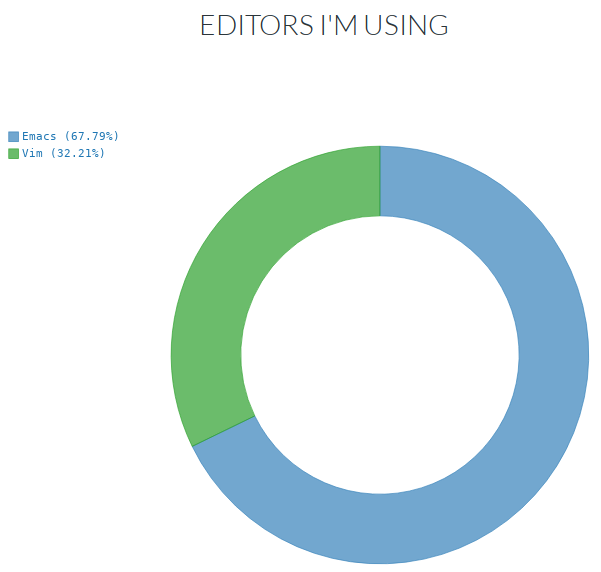
Nothing new here, 70-30 between Vim and Emacs.
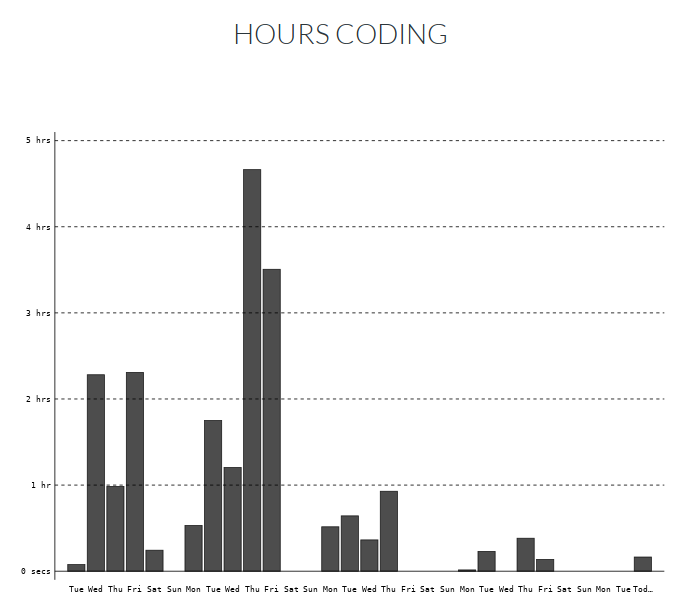
I had some national holidays + days off this month. Also, I had some non-coding tasks (mostly writing) and it obviously impacted my hours of coding.
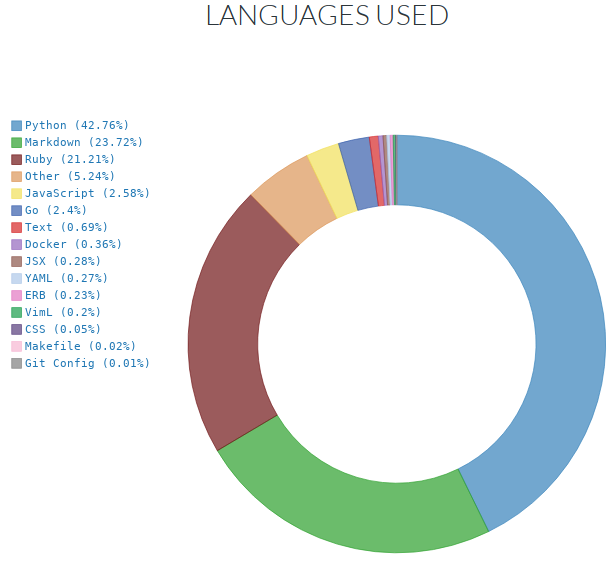
Python, Markdown, and Ruby are the most used languages, as
usual. Unfortunately, there’s no mention of Rust or Elixir this
month, but at least I have a small percentage of Golang.
Speaking
Again, no speaking this month. I was thinking about it, and I think it is a hangover from the 21 presentations from last year.
Completed tasks
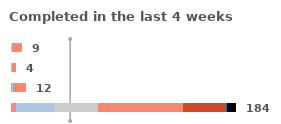
Here is the comparison of the tasks for the last month (first) and the tasks for this month (second). I extracted it from Todoist.
Things are back to normal, I guess. 🙃
Podcasts
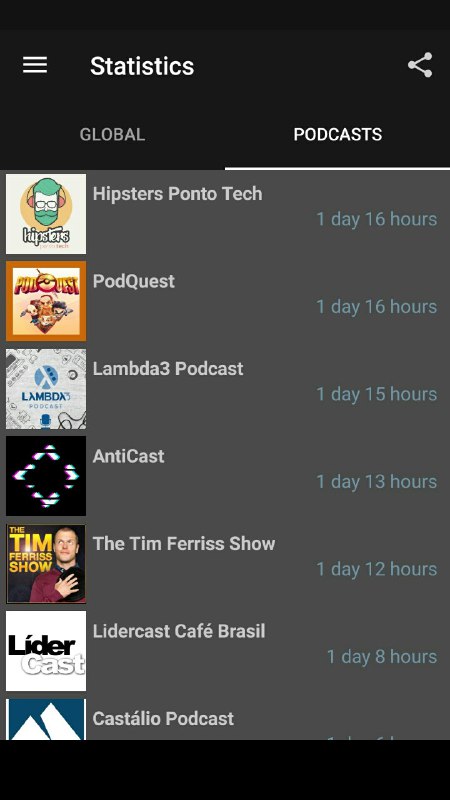
Here is my Podcast Addict stats:
3 days and 6 hours of podcast time. It seems that 3 days is becoming average for me. As usual, here is the list of Podcasts and their times:
Remember that this is an “all-time list”, and I’m tracking time instead of the episode which makes short podcasts not to appear as “most listened” ones. I listen to CBN podcasts almost every day, but they are just some minutes long.
Hours working
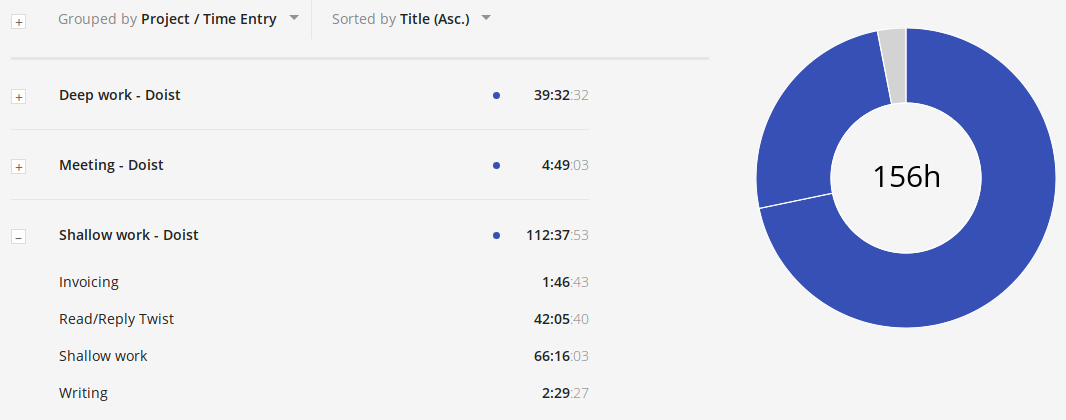
Here is the data from my time tracking software, Toggl comparing the last month (first) and this month (second):
I had 19 work days tracked this month, and I worked for 157 hours, which mean that I worked 5 hours more than I should (it was 11 in the last month, so it’s improving! 😀).
Let’s check Deep work versus Shallow work:
What I can take from this chart:
- Meetings are stable (and productive), considering two 1-1 meetings (1 hour each) and four weekly meetings (around 40 minutes each)
- The Shallow work task (the most generic I have) is still the big black box. I mentioned to split the lunch time (lunch and break) but forgot to do that last month. Maybe I will start doing it this month (from April 15th).
“Read/Reply Twist” is still consuming a lot of time, more than 2 hours every day. Let’s break Twist usage down by hour:
It seems that my strategy of reading Twist in the morning is working, but it’s not fixing the problem of keep looking to it throughout the day. I should probably just skim it in the morning and get back to it at the end of the day. Still trying to improve this process though.
Now, let’s continue to my personal projects, last month first and this month last:
Again, that’s not much to compare here, but at least it seems stable. 👍
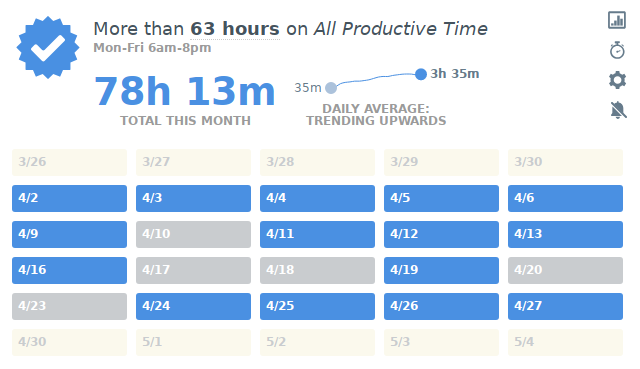
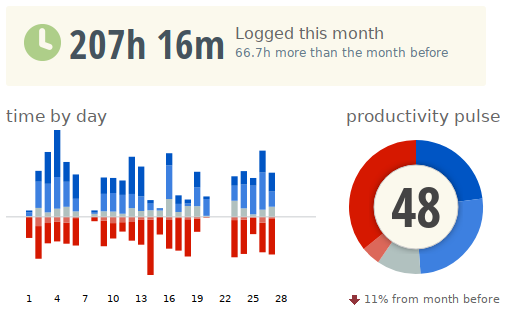
Here is my data from RescueTime:
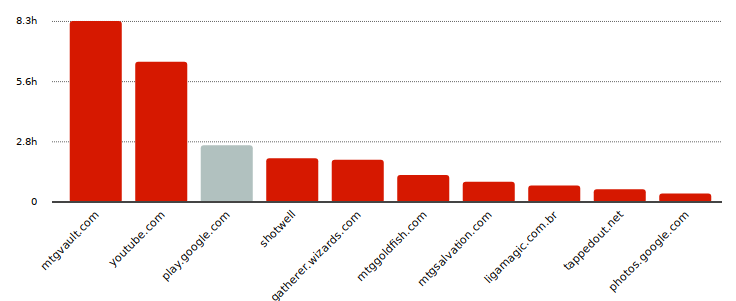
It’s worst than February and March 😞. I had a pulse of 62 on February and 54 on March, and it’s now 43. It concerns to see that, so I decided what was causing such different. When looking at the chart for the entertaining category, I saw this:
It seems that my new (and old, at the same time) hobby Magic the Gathering is taking a lot of my spare time. I let rescuetime track all my time, not just working hours, and all MTG websites are considered as very distracting. Maybe I should configure rescuetime to monitor only “working hours”, but I’m not sure what time should I use. 🤔
Still following my Telegram usage, here is the comparison from the previous month to the current one:
It’s still too high for me. I have an alert of my time spent using Telegram. The goal is not to receive this alert, but I’m currently failing at it. I have to improve this.
I’m still trying to understand if I have a particular moment where I use Telegram the most, here is the difference from the last month to the current one:
Hm, Telegram usage is spread throughout the day, that’s not a good thing. I have to keep working on it.
Physical activity
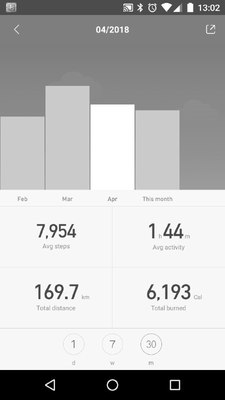
I’m using my Mi band data to calculate my average steps:
This month I have 8k steps compared to 10.5k from the previous month. This change is expected since I had two weeks to move around because of the retreat and my vacation in Santiago last month.
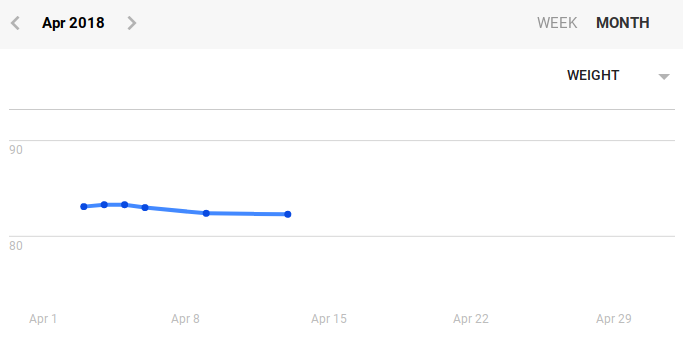
I was expecting a big change in my weight, but it was not that bad. I’m expecting an increase next month though 😅:
Here is my sleep data for this month:
Not that bad, the same as March. Hope to improve it in May. 👍
TV Shows
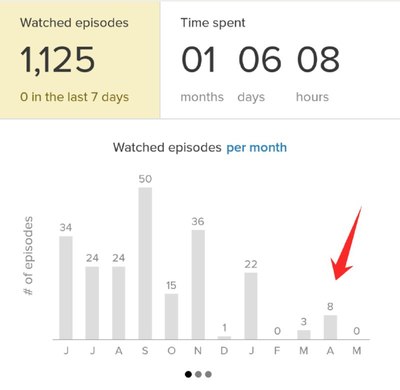
According to tvshowtime I watched 8 episode this month:
We finished The punisher this month. Now looking for a new TV show to watch.
I’m starting to try trakt.tv, so I can try the movies I watch along with the TV shows. Unfortunately, tvshowtime only tracks TV shows. Maybe we will have some new charts next month. 😉
Words written and errors
I’m using Grammarly to improve my English and track the number of words and errors when I’m writing. Unfortunately, they only send weekly emails, but I will try to keep this metric for a while.
Here are my stats for this month:
- 61385 words written ( 50348 last month)
- 934 corrections made (825 last month)
- 16473 unique words (10944 last month)
It’s expected to have a better value since last month had almost two weeks off because of Doist retreat + vacations. Nothing outstanding though.
Locations
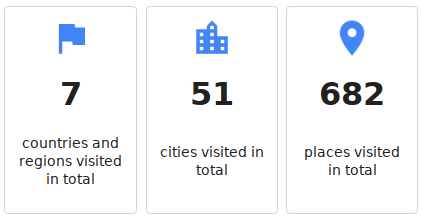
I’ve added some places to the list:
Went to two different cities this month, one of them is 450km+ from my hometown. ✌
Let’s compare the difference between last month and this month. Last month first and this month right after it:
And again, One new country according to Google. It’s quite unstable to rely on their country count, but I think they got it right now. The number of cities did not increase for some reason. 🤷♂
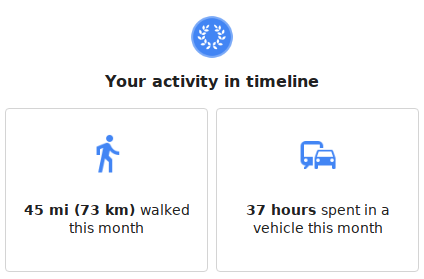
As expected the amount of time commuting increased a lot this month (due to the travel I mentioned above):
Still many kilometers to “reach the moon”:
Expenses
It’s time to check my expenses! 💰
My earnings this month were different from what I usually receive. All of this thanks to the profit sharing I receive from my previous employer. Considering that, I spent only 17% of the money earned this month.
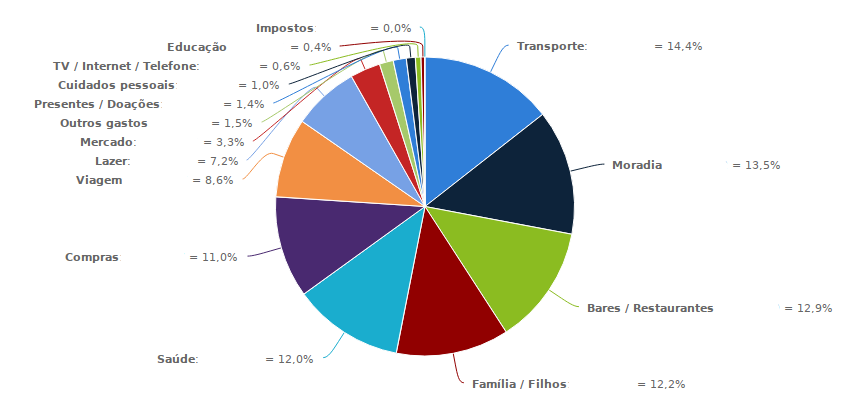
From this 17%, we have the following percentages:
I was expecting much more from Viagem (traveling, the orange piece), but it’s good enough. Transport is the biggest one, but part of it will probably be reimbursed, as it’s my wife’s work expenses. With that said, Moradia (housing?) is my most significant expense.
As usual, I’m not considering the money in transit from my company to my personal account (waiting for money exchange, taxes, accountant payment, etc.). So, without considering it, and keeping in mind that Easynvest (one of my brokers) has a crappy system that doesn’t work, making me waste my time trying to retrieve the latest information about my investments, my total savings increased by almost 4% (!!) and now I have 94.06% of my goal.
Time to write this blog post
Some people are asking me about how much time it takes to collect all the data and write the blog post, so I decided to add this metric
It took 3 hours and 31 minutes
It is quite stable since I spent 3 hours and 30 minutes last month. That number considers the whole process of organizing my data (I usually review my investment portfolio as well), taking screenshots, and writing this post.
Conclusion
It was a standard month. Some outliers were found because of my Magic The Gathering hobby and 20+ hours commuting because of my travels is not that common, but other than that, everything is just fine.
See you next month. 🖖

