18 minutes reading | Também disponível em 🇧🇷
2017 Year in Review (with metrics!)
Brace yourselves, this post will be HUGE
TL;DR: It was a great year and I’m really glad to see the metrics and notice everything I accomplished.
I don’t remember the last time I posted my yearly review publicly but as I’m doing monthly posts of my stats, it makes sense to do an annual review as well.
I do yearly reviews since around 2005 but I never post them publicly. I also write down my goals for the next year, so I can review them in the last week of the year (like I did some weeks ago). I write a lot of content but usually don’t publish it because I try to keep this blog less personal. The stats posts are here because I really think it’s great to have metrics about yourself, so you can evaluate and improve (remember: continuous improvement). These posts aim to show that in a practical way while helping me to commit to writing them monthly.
I will try to follow a template like the one I use for my monthly stats but I will also add some other items and notes about my goals.
✅ Books
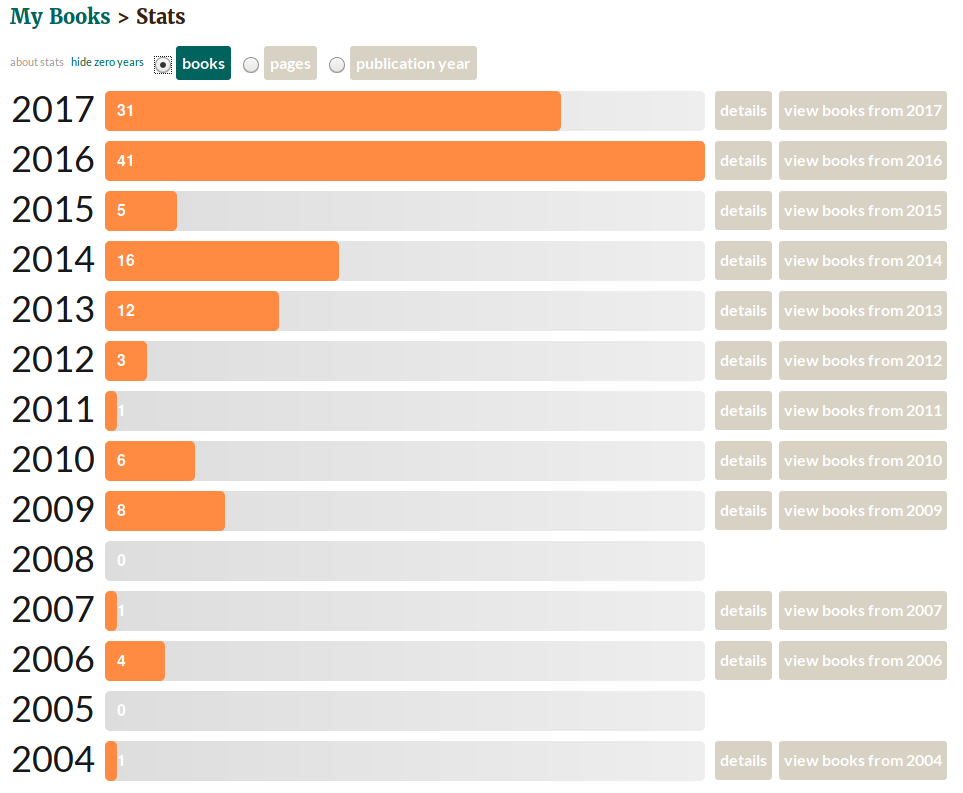
My yearly goal was to read 30 books this year and I read 31.
Last year I read 42 but I decided to not be so aggressive this year and try a different strategy. The idea was to add a full review on Goodreads after the book is finished, so I can think about how much I understood and retained about it.
The experiment went really well and helped me with the process of adding more notes about the important parts (IMO) of the book. I’m using Google keep for that, using a label for book notes. These notes help me to get into the context of the book. They are also easy to find using Google Keep’s search engine when I need to find a reference.
Here are the books from this year’s list that I really recommend reading, with links to my review:
Non-Fiction
- Mastery
- What Doesn’t Kill Us: How Freezing Water, Extreme Altitude and Environmental Conditioning will Renew our Lost Evolutionary Strength
- Radical Candor: Be a Kickass Boss Without Losing Your Humanity
- Spaceman: An Astronaut’s Unlikely Journey to Unlock the Secrets of the Universe
- Deep Work: Rules for Focused Success in a Distracted World
Fiction
You can always look for my whole list of books read this year on Goodreads.
Here are some stats provided by Goodreads comparing all the books I have registered:
I started listening to audiobooks in 2016 and it was a huge difference in my life, as you can see in the charts above.
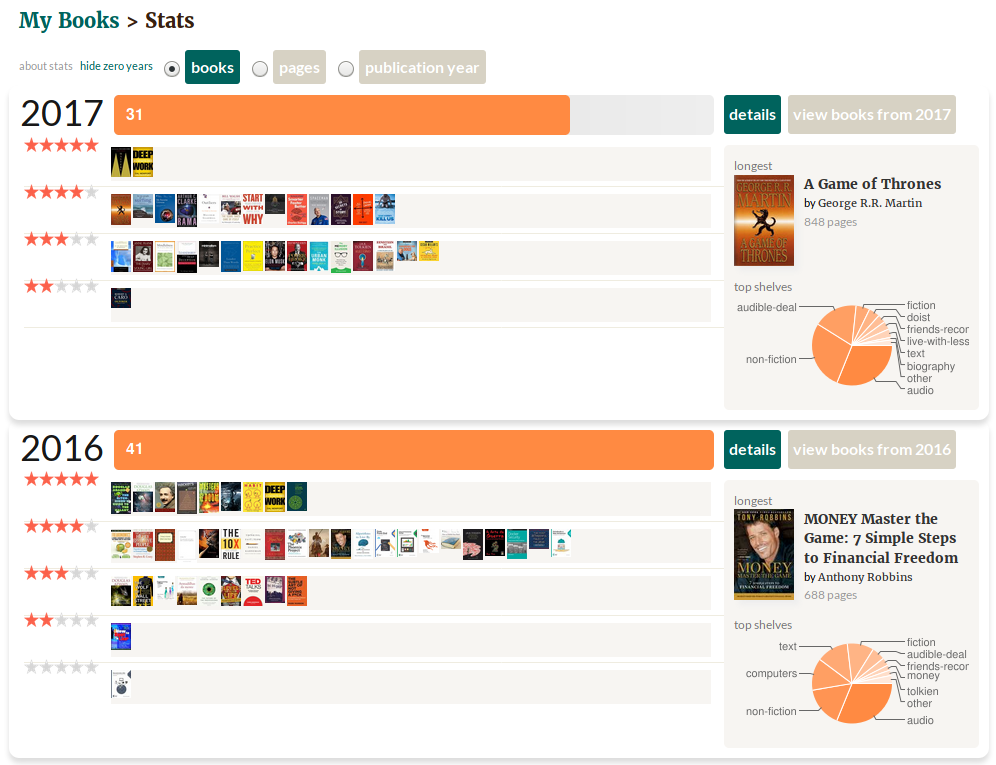
Let’s compare the books I read this year with last year:
10 books less than last year but it was expected. What bothers me is that I only gave 5 stars to 2 books (comparing to 9 last year) and the number of books with 3 starts is higher than the last year.
The number of books in the “audible-deal” shelf is higher this year and most of the books in the 3-stars row are on this shelf… Maybe the deal is not worth the price after all.
Even with the high number of books in the 3-star row I’m happy with my results for 2017 regarding books. Mastery was the shiny pearl of this year, I really like it.
✅ Articles
Unfortunately, I don’t have data for the whole year but I can use the data I have from March to December.
I could not find a good way to track the articles I read. While I’m still looking for a better way to do that, I’m using Pocket and manually checking it every month. It means that every article I read since March was added to Pocket. Sometimes I read from there but others I just add it there to count as read.
In March I had 760 articles Unread and 570 articles Read. Now, using the data from my December stats post, I have 1296 articles Unread and 946 articles Read.
It means that I read 186 articles this year, an average of 15 articles each month. I’m aware that I will probably never read all those 1296 articles left in my Pocket account and I’m OK with that.
Worth mentioning that my definition of article read is when I found some interesting and useful article and read that from bottom to end.
I had no goal for reading articles but I decided to track that to understand how much I read every year. Before starting with audiobooks I was really frustrated with the state of my reading stats. I was not reading many books in the year but I had a feeling that I was reading many articles, which is not so bad. By tracking that I have the data I need to prove to myself that I’m reading enough, which helps with the impostor symdrome.
✅ Coding
All my coding metrics are provided by Wakatime.
First, let’s take a look at the total time coding:
I confess that I was expecting much more than that. An average of 1h31 per day looks really low for me.
I felt better when checking the comparison with the user base. It shows that I have almost twice as many hours coding! :)
The low number of hours is probably related to how Wakatime gets the stats.
This year I did a lot for this blog:
- Changed the entire layout
- migrated it to Hugo
- converted all posts to Hugo format
- redirected old URLs to the new content,
- wrote 19 posts (my goal was 10! 😃)
It’s expected to have my blog as the first in the list of projects for this year.
It’s really interesting to have my freelance project as the second one because I almost not work for them in the last 6 months! It says that I was working for them a lot in the beginning of the year.
I’m really proud to have Todoist on my list of projects this year. I’m using/following Todoist since 2007 and it’s amazing to have the chance to contribute to the app. 🙂
Looks like I fully switched to Emacs. I’m not using Vim as I used before but sometimes I miss some Vim features. I was talking to a friend last week about it and I mentioned that if I was still using querty (I use Colemak) I would probably be still using Vim. Emacs is nice and so is Vim. :)
I was using a plugin to register my terminal usage but I think it generated more noise than signal. 😞
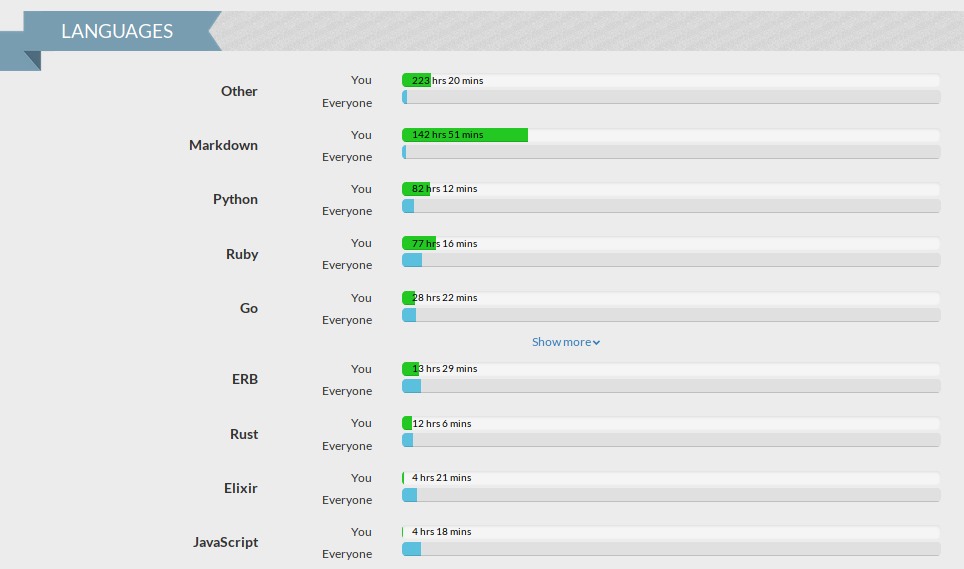
Markdown is the first one for many reasons:
- I wrote many posts on my blog
- I’m responsible for Todoist and Twist documentation
- I usually write long post in Emacs and then paste them to Twist
Other than that, we have Python, Ruby, Go, and a little bit of Rust, Elixir, and Javascript. I was playing with game development in Javascript this year and I really bet in Rust and Elixir, both languages are really great. I don’t think I will have enough ground to play with Elixir this year but maybe Rust will have his time in my schedule in 2018. 😃
Go is on my top 5 list but I’m not totally comfortable as I would like to be, hope to improve it in 2018.
Forget about “Other” it’s related to Bash because of my plugin. 🙄
In general, these are great results IMO. 😃
✅ Speaking
I have to say that I’m really proud of myself on this one. 😃
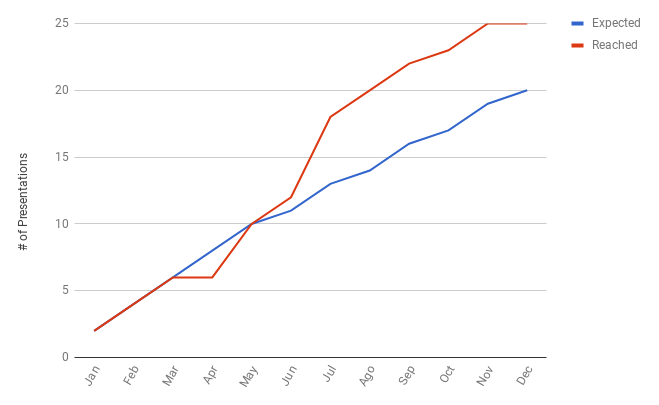
Here is the burndown chart I created to follow up each month (nothing fancy, a simple Google spreadsheets):
For those who don’t know yet (because I usually don’t post publicly many things), I was in a “competition” with Milhouse’s last year ghost.
This story is worth sharing since it was part of my goals:
In December 2016 I asked Milhouse about how many talks he gave and he said it was 18 talks. I was stunned. At the time, I was really proud of my personal record of 12 talks in one year and I know it was really hard to achieve this number. I asked him to post about it on his blog and here it is. When I saw that, I started a competition with myself, my goal was to speak in 2017 more than Milhouse did in 2016.
It looks like a time trial race in video games when you have to defeat your own “ghost” or the “ghost” of a friend. For those who played bike racer from Top Free Games, it’s just like that.
It may look silly but I always do “competitions” like that to motivate myself. Sometimes I use my own data and others I use the data from someone I admire or someone who did amazing things. This time was really nice because I told that I was doing it to some friends (including Milhouse) and it was a cool internal joke between us.
Thanks to that “competition” I could motivate myself to:
- Propose a talk to FOSDEM and speak outside the country in a different language. Milhouse had 1 talk outside of Brazil, so I had to beat that. For this reason, I spoke in Belgium and Portugal.
- Speak 3 times in the same conference (TDC) about 3 different languages (Go, Ruby, Javascript) and 3 different fields (CLI, Web, Games)
- Do 5 talks with live-coding. 3 of them starting from scratch, with a blank text file and 40 minutes of time (For those who don’t know, one of my biggest fears was live-coding talks)
Met a lot of new people, studied many languages, and had a ton of fun. I really recommend this motivation hacking. It’s not just for speaking, you can use it for anything you want.
✅ Completed tasks
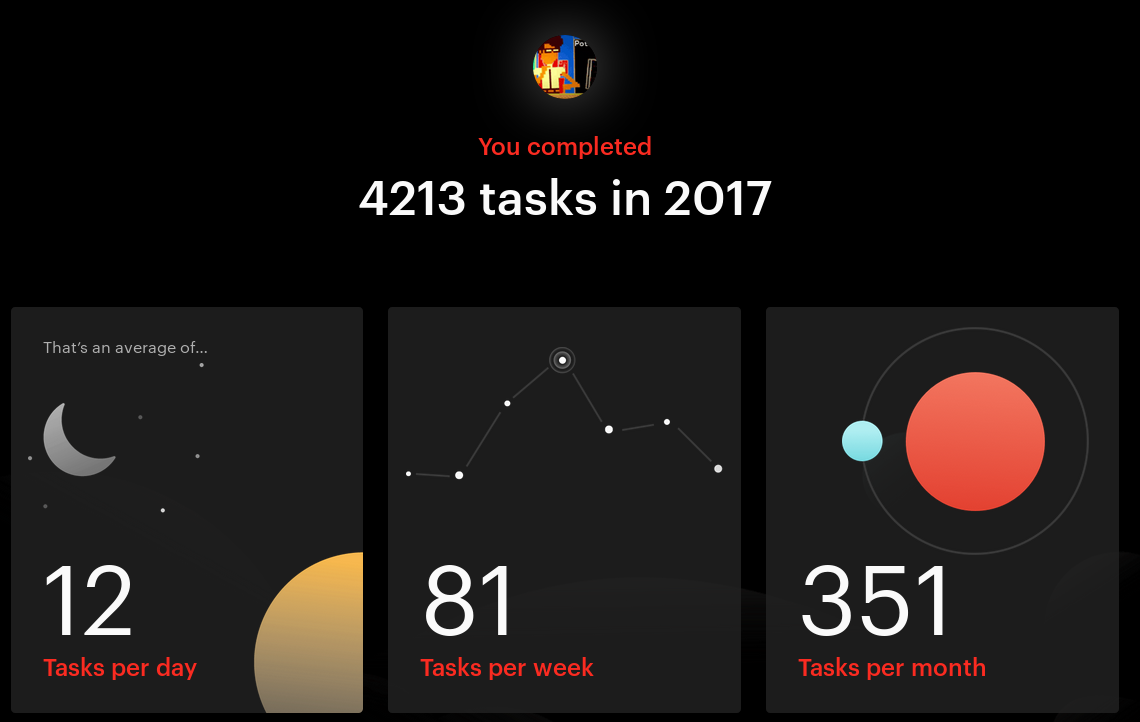
In the last years, Todoist is providing a Year in review and this year is no different. If you’re a Todoist user, you can check your data here.
Let’s check my Todoist tasks! 🙂
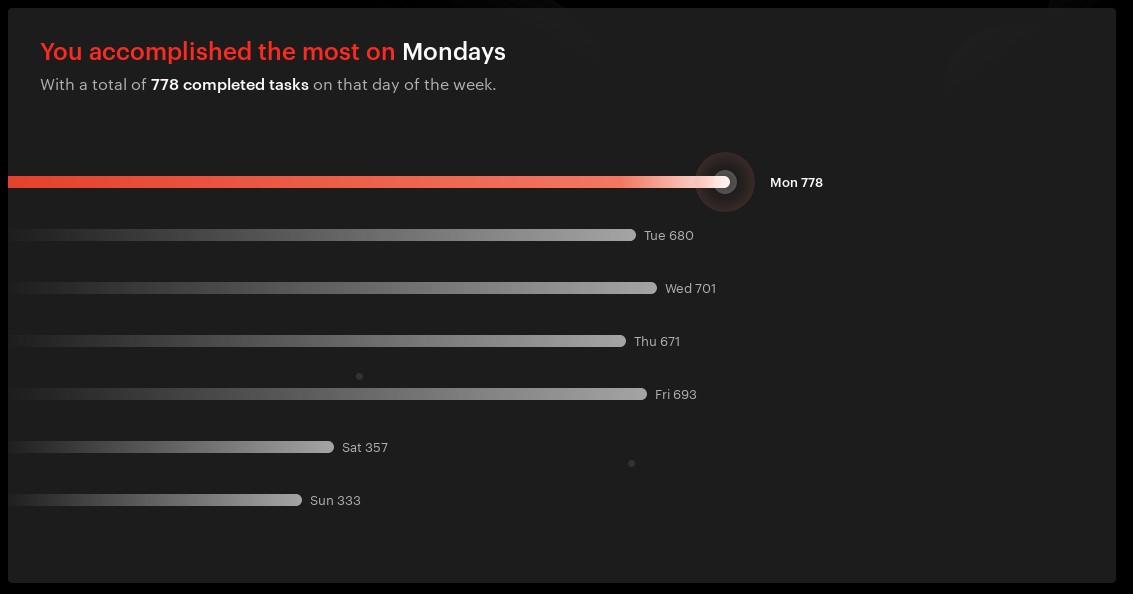
Hm, less than I expected but still OK. I was already expecting for that but looks like Monday is the day I complete more tasks:
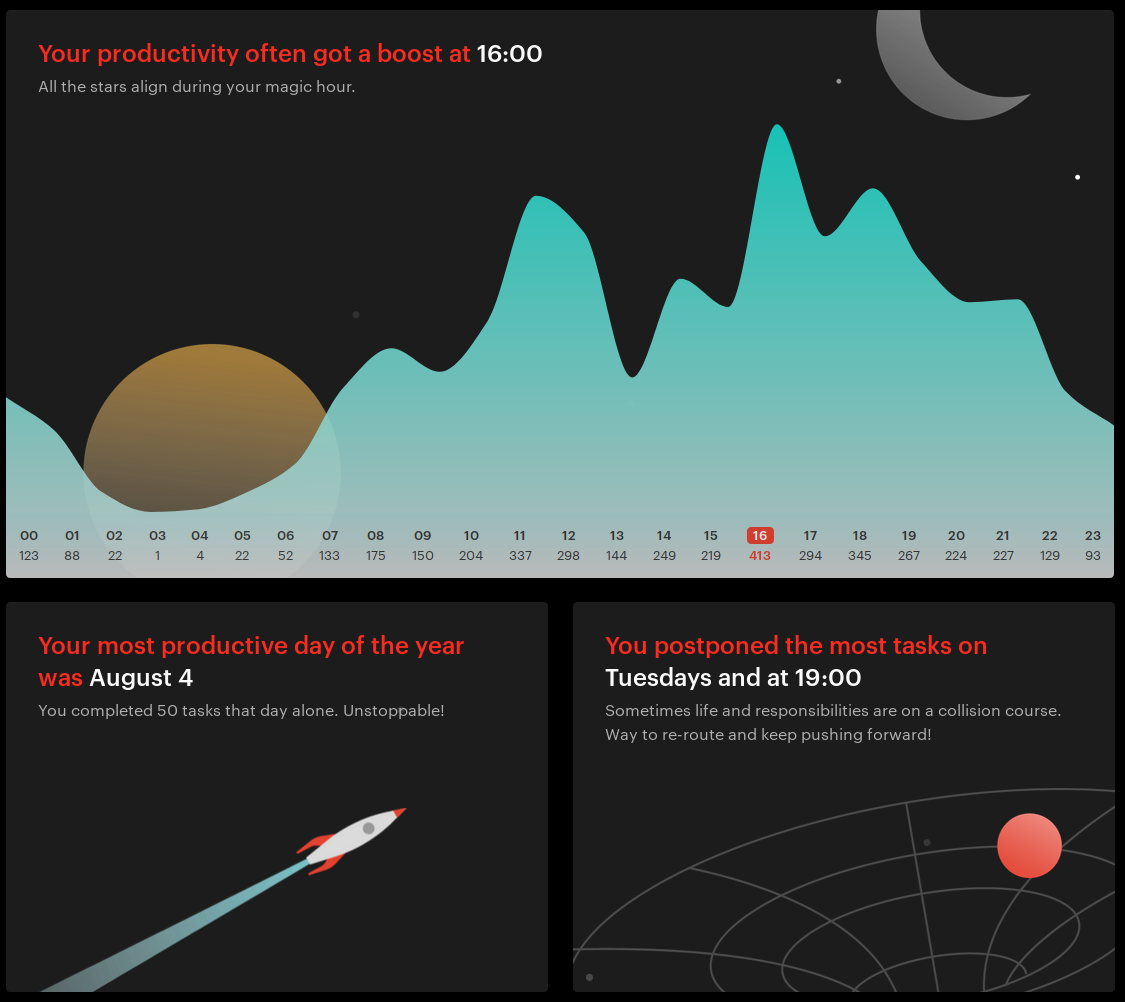
My most productive time is 16:00 and what I can’t finish at this time I usually postpone at 19:00 😬:
I’m in the top 1% of all Todoist users in 2017! 😃
This Year in Review by Todoist is astonishing! I had the chance to contribute by helping with the pt-BR translation. 🙂
✅ Podcasts
587 hours listening to Podcasts. If I was listening to the episodes in normal time (spoiler: I wasn’t) it would be equivalent to more than 23 days of non-stop listening. My app says that I listened 17 days and 7 hours, but I decided to not trust it because I changed my Podcast application in the beginning of the year and restored a backup after it, so I don’t know if it’s accurate. Instead of using the value calculated by the app, I calculated month by month based on my posts.
I consider that one month of extra time since I listen to Podcasts while commuting, walking the dog, washing the dishes, doing exercises, etc. It works really well for me and sometimes I change between Podcasts and audiobooks.
✅ Hours working, focusing and distractions
Let’s review how was my year related to work. This time I have a lot of metrics to correlate. \o/
If you’re following my posts or social networks (Twitter is the only one I’m using) you know that I changed jobs in June. I expect that to have a huge impact on my metrics.
Let’s start with time working, considering my full-time job only:
It increased a lot from July to December. At Doist, they recommend to not work more than 8 hours a day and I’m clearly not doing that. 😞
Including my freelance job:
It looks more even now but I don’t know if it’s a good thing. I don’t usually work as a freelancer but I work for 1 company for almost two years now and I really like the challenges they have there, so I would like to work for them again. To be able to do that, I have to stabilize my workday.
From July to December I did almost no freelance work for this company:
A goal for the next year is to work smarter not harder, so I will have more time to do other things not related to my full-time job. I really like my full-time job (more than ever!) but I like to do different projects without constraints, it can be this freelance job or other activities that also bring me joy.
There’s one metric that makes me feel great. I’ve been tracking the amount of Deep work I do at work since the beginning of the year. I consider something to be Deep work when I close all external interruptions (Telegram, Slack, Email, Twist, Cellphone, etc) and focus on the work I have to do. And for this year I have this:
What an AMAZING thing to see. I really like when I’m on the flow state focusing on my task. That chart shows me that I was happier than before. 🙂
As I realized that it would not be possible to apply my deep work techniques in my previous job I was applying that on my freelance work. If I add to the chart all the freelance work I did for that company (features, bug busting, infrastructure) we have this:
Which is not that bad. 🙂
The good part is that I can apply Deep work to my full-time job instead of look for a different place to use it. 🎉
I would love to track the time I spent in meetings comparing the first
semester and the second but I was not tracking it in the first
semester. Now, giving that a second thought, even if I tracked, it
would be more noise than signal. Sometimes you have productive
meetings and other times you have “meeting that need to be done” where
people keep talking about the unrelated stuff in the first 20 minutes
of the meeting to speak about the productive stuff after
that. So… ¯\_(ツ)_/¯.
I also have a metric for the time I spent doing/planning my talks this year:
Sometimes I did not track it at all, especially in the beginning of the year, but it’s worth mentioning as well. In April and June, I was practicing for my live-coding session. 🙂
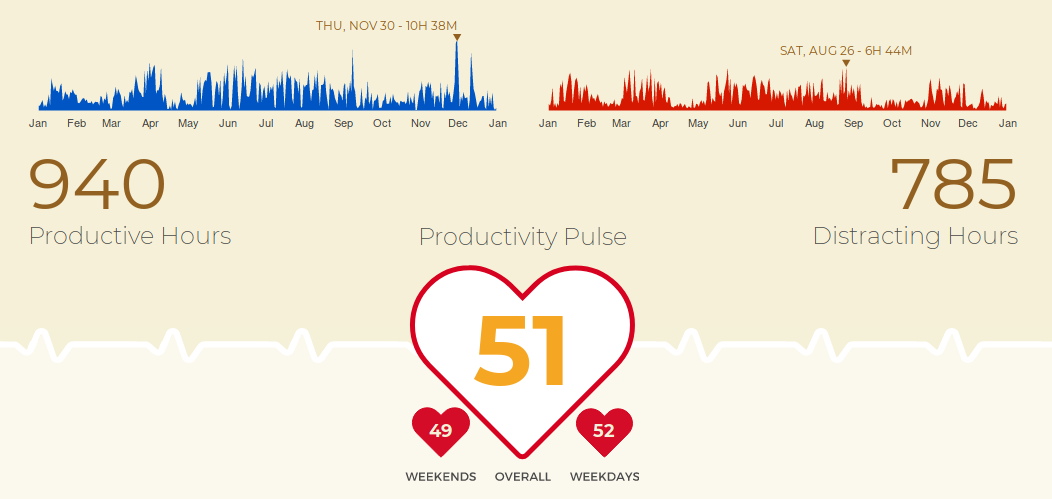
I’m also using rescuetime to track my productivity. I’m not sure if my configuration is good and I keep changing them, so these metrics may not be so accurate. A good example of that is my tracking time, I’m also tracking the time at night when I’m talking to friends via Telegram or over the weekend.
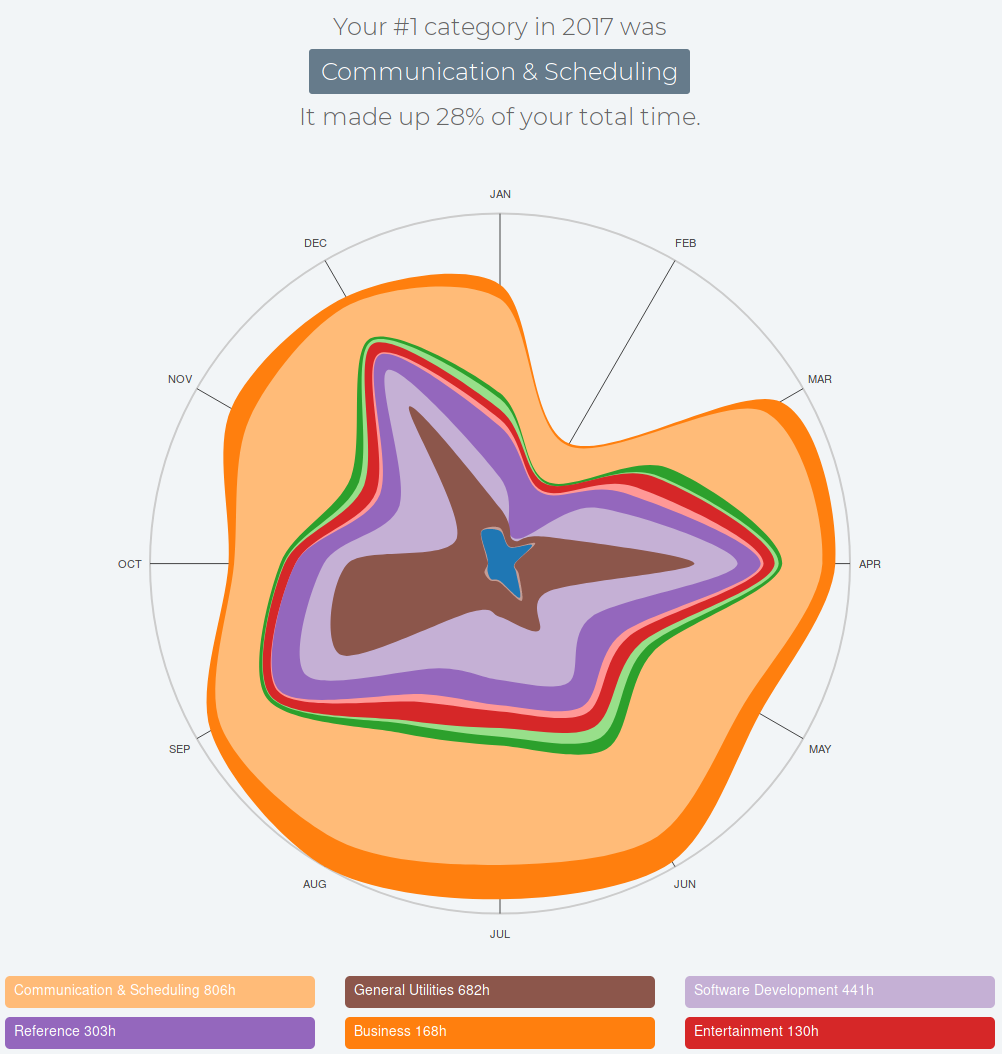
Let’s look at the productive and distracting hours for the entire year:
A lot of distracting hours. As it considers my weekends and nights, I don’t think it’s accurate. It still bothers me that “communication & scheduling” is the most used category. I will change that this year.
Music
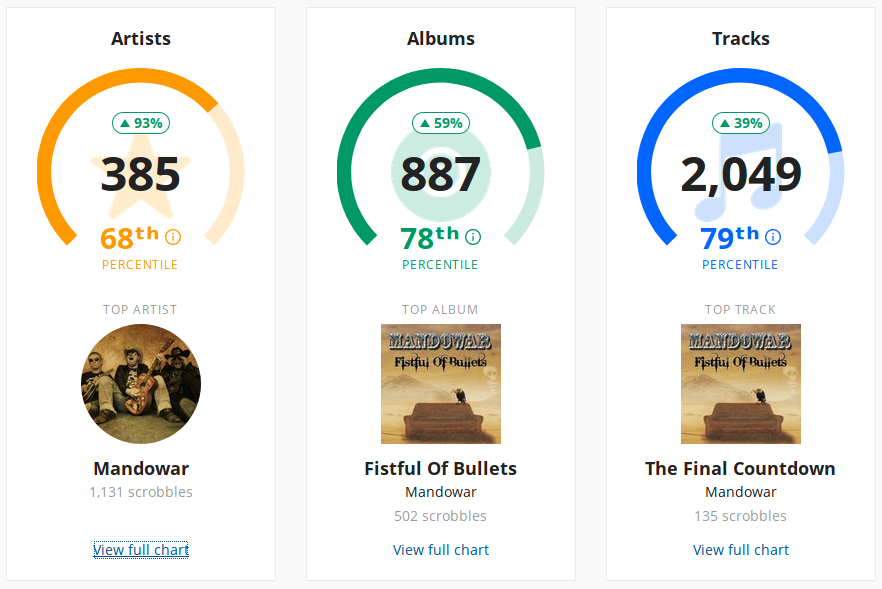
I usually don’t talk about music but last.fm did a good “year in review” for me, so I will add some stats here.
I started using the paid version of Google Music this year, that explains why my “Discovery” has an increase of “558%” this year. I also almost doubled the number of artists I listened this year.
Some interesting statistics are related to the time I listened to more songs. It seems that I listen to more songs between 20:00 and 21:00. It’s usually when I want to do something different and need more energy. Wednesday is the day I listen to more music, I have no idea why it’s so different than the rest. 🤔
And the obvious part… I listen to metal most of the time. 😜
TV Shows
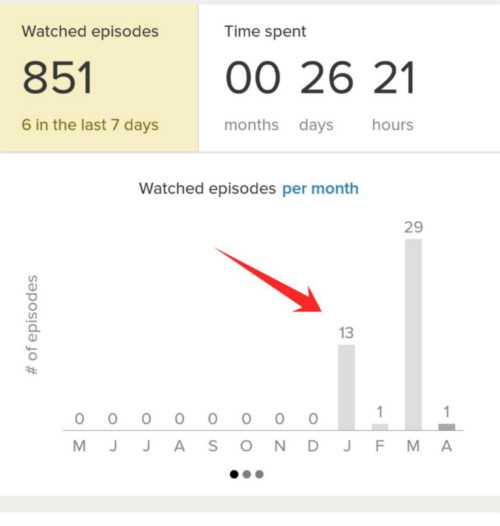
I will use my tvshowtime stats to get some data about it. Here are my data for January and December:
Based on that (and ignoring how much I watched in January) I can get to the conclusion that I watched 241 episodes, more than 4 episodes a week.
Let’s imagine that tvshowtime uses 30 days for one month. In this case, I spent 8 days and 5 hours of my year watching TV shows.
As I don’t usually watch TV, I will consider that 1 week and half of my entire year was spend watching TV. It’s 2% of all my time spent with TV, not sure if it’s good enough.
Physical activity
I was expecting to have an easy work on this one since I have some apps for metrics but turns out that it’s not so easy to retrieve yearly information. 😞
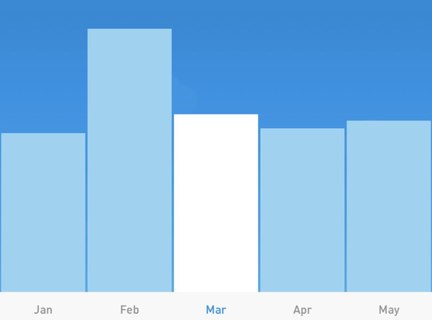
What I did to get the information I need was to look month by month and take screenshots on my cell phone. I’m not including November and December because December is truncated in the monthly view for some reason and it would be too much work to include November alone. It was not so easy or pleasant to get that but here is the data regarding my steps:
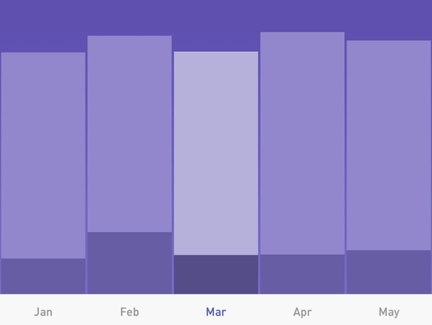
Nothing so unusual. It was mostly stable and I had peaks in February and October, the two months I was traveling to Europe.
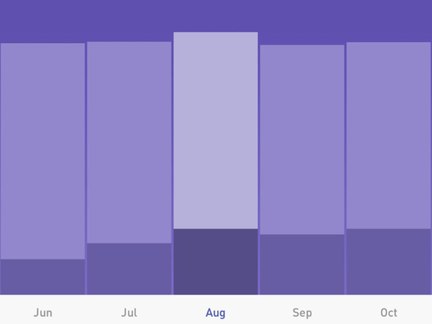
Regarding my sleep:
Looks like my deep sleeping (the dark purple) increased in the second semester. It’s interesting because it correlates with the dates I started in my new job at Doist. In February, when I was not working, I had a good rate of deep sleeping as well, I will assume it was stress related to my previous job.
In general, it looks good to me.
✅ Words written and errors
After consolidating all the data I collected from Grammarly this year I have the following:
I just copied and pasted all the data from all posts into a Google Spreadsheets and generated a chart, no science here. January, February and March have no data, unfortunately.
The interesting metric I can get from this chart is that I’m writing a lot more and the corrections made are not increasing at the same pace. This is really great to see. 😃
Unique words are stable since I started tracking my words. Looks like my vocabulary is not increasing but I think it’s normal, we usually don’t use difficult words in our day-to-day life.
✅ Locations
This year was amazing regarding traveling. I went to Belgium, Netherlands, Scotland, England, Portugal, Spain, and visited many different cities. I’m planning some posts about those cities for a while now, maybe someday.
In one of those trips I had a goal to speak with people from other countries and had long conversations with people from Germany, Poland, Spain, Scotland, Colombia, Canada, Lithuania, Czech Republic, Japan, Brazil, Uruguay, Australia, Russia, Ireland, Portugal, India, Belgium, Bosnia, France, Argentina, and Netherlands. It was really great. 😀
Now that you know about the trips, I don’t know if I can trust the data provided by Google Locations. Take your own conclusions:
Unfortunately, I don’t have my data for January, the first record was in February (after visiting more than 13 cities in 4 countries):
And this is the data for December:
It doesn’t look so different even with all those travels. Considering that I visited Porto, Lisbon, and Barcelona in October, it doesn’t make any sense. 😞
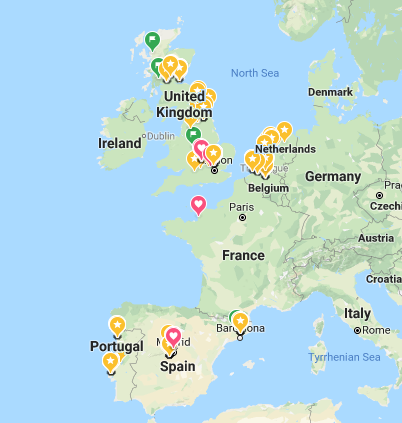
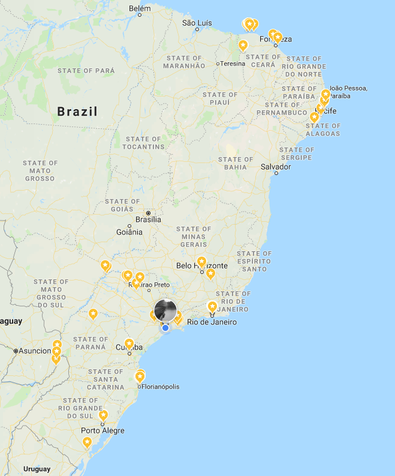
I use Google maps and Google trips to find new places to go. I’m a Google maps local guide and I usually add reviews to the map. As a side-effect of that, I have stars in almost all places I go.
I hope to have many other stars soon. :)
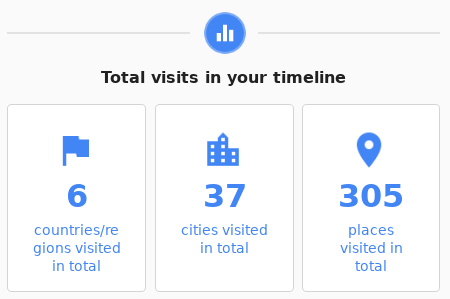
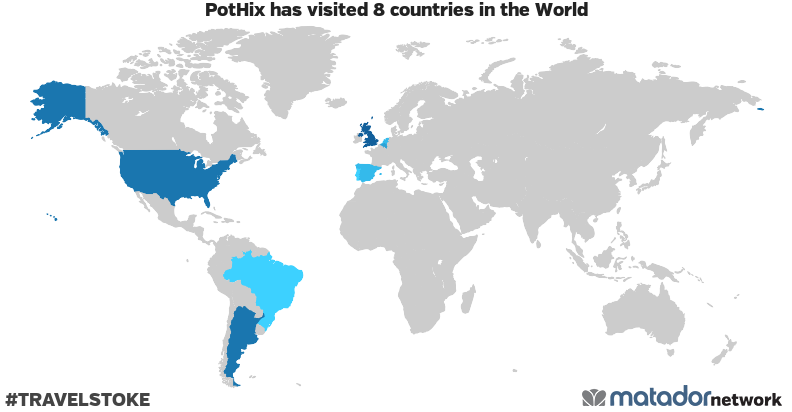
According to matadornetwork, I visited 8 countries so far:
✅ Expenses
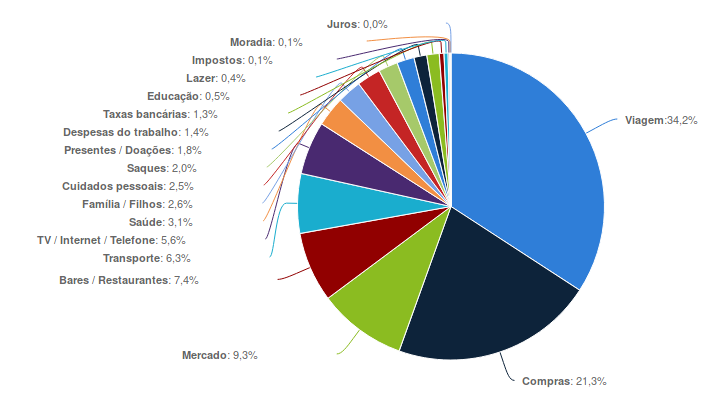
I would love to do a deep analysis on this topic but unfortunately, the apps I use do not provide an easy way of doing this. The only thing I got was this chart for the last 6 months:
The legend in the left is not so good because I had to remove the actual values in cash to keep the percentages only. 🙄
Looking into this chart I can see that “Viagem” (travel) took almost 35% of my expenses. I tend to live a frugal life, so it makes sense to have my travel expenses taking most part of my money spent. For me, traveling is an investment and I don’t regret spending money on it.
It bothers me that “Compras” (general spending) is the second category of my expenses. I was expecting to have “Mercado” (groceries) here or maybe “Bares / Restaurantes” (eating out), but not “compras”. I will look closely at it this year because it’s an yellow flag for my expenses.
Regarding my savings, it increased by 16.83% this year, considering the value I had at the end of April (I don’t have data for Jan, Feb, and March). It’s an average of 2.10% for each month, so if we apply that for January, February, March, and April, we would have 25.25%. In the end of the year, I had 75.10% of my savings goal.
Considering that I did not receive any payment in the last 6 months, it’s really great! I’m already expecting for a huge increase in my savings for January when I received the payment for the work in the last months. 😃
Time to write this blog post
Well, this one took some time. 😜
I started it on the airplane, coming back from York. Unfortunately, I lost my tracking because of a software problem but I doubt I spent less than 2 hours on it, so let’s consider 2 hours.
After that I worked for 07h15min more, so we have 9h15min to write this blog post and it worth it, for sure.
Conclusion
What a great year! :)
It is the first time I have that so much metrics to play with. I could get some interesting information about how was my year and how some changes influenced my behavior for good or bad.
It took a lot more time than I was expecting but I hope to have an automated way to do that in the next year.
I achieved almost all of my goals last year, so I don’t have anything to complain. Hope that this year become even better than the last one.
